OCR · A-Level · Biology
Course version: H420 · Version from Sept 2025
(i) selection and labelling of axes with appropriate scales, quantities…
Full specification wording
Analysis: (i) selection and labelling of axes with appropriate scales, quantities and units
When you plot data from a practical, the graph must let a reader read values without guessing.
Checked against the OCR H420 specification (opens in a new tab) on .
- Point 3 of 4
- 4 key terms
Study notes
From the checked teaching notes for this specification point.
The idea
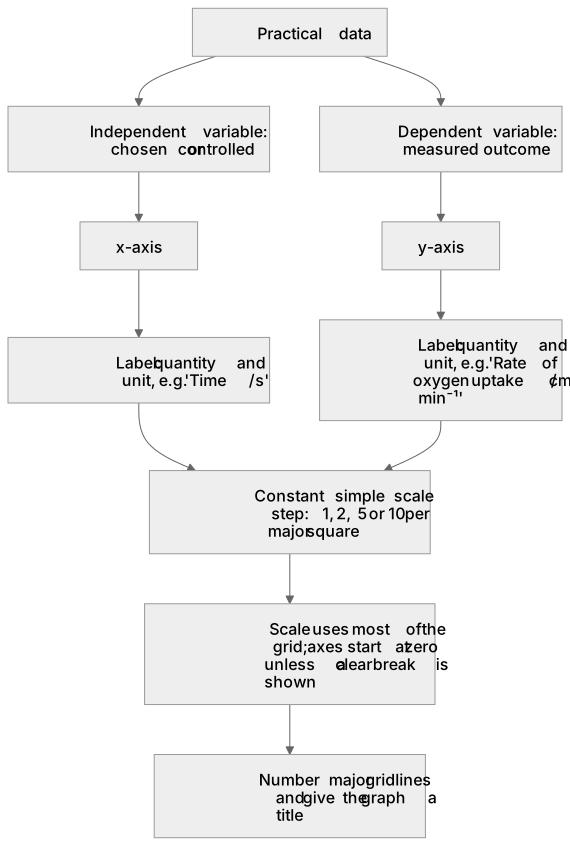
When you plot data from a practical, the graph must let a reader read values without guessing. Decide which variable is independent (you chose or controlled it) and place it on the x-axis; place the dependent variable on the y-axis. Label each axis with the quantity and its unit, for example 'Time / s' or 'Rate of oxygen uptake / cm³ min⁻¹', using a solidus or brackets so the unit is unambiguous. Choose a scale that uses most of the grid: pick a simple step such as 1, 2, 5 or 10 units per major square so intermediate values are easy to read, and keep the step constant along the whole axis. Start each axis at zero unless the data range makes that wasteful, in which case a clear break may be shown. Number the major gridlines rather than every small square, and give the graph a title stating what is plotted.
What earns the marks
- Identifies the independent variable and places it on the x-axis, with the dependent variable on the y-axis.
- States that each axis label must give the quantity and its unit, e.g. 'Concentration / mol dm⁻³'.
- Explains that a constant, simple scale step (such as 1, 2, 5 or 10 per major square) makes values easy to read.
- Recognises that the scale should use most of the available grid so plotted points are spread out and readable.
- Notes that axes normally start at zero, with any break clearly indicated, and that major gridlines are numbered.
- Describes checking the finished graph so that any point can be read to the nearest small division.
Common mistakes and how to put them right
Putting the dependent variable on the x-axis.
Put it right: The variable the experimenter sets or controls goes on the x-axis and the measured outcome on the y-axis.
Labelling an axis with a bare number or a bare word such as 'time' without a unit.
Put it right: Give both quantity and unit, for example 'Time / s'.
Choosing an irregular scale so that equal distances represent unequal steps.
Put it right: Use one constant step along the whole axis.
Exam tips
- Read the axis labels in the question stem before answering; the quantity and unit must both be present.
- Check the scale by counting the value of one small square and confirming it stays the same across the axis.
- If asked to improve a graph, name the specific fault (axis swapped, missing unit, uneven scale) and state the correction.
Try the lesson
The start of the Analysis: (i) selection and labelling of axes with appropriate scales, quantities and units lesson, made from checked teaching notes for this specification point.
Have a go first
A graph shows how the rate of water uptake by a shoot changes with light intensity. Which y-axis label correctly includes both the quantity and its unit?
Listen
When you plot data from a practical, the graph must let a reader read values without guessing. Decide which variable is independent (you chose or controlled it) and place it on the x-axis; place the dependent variable on the y-axis. Label each axis with the quantity and its unit, for example 'Time / s' or 'Rate of oxygen uptake / cm³ min⁻¹', using a solidus or brackets so the unit is unambiguous. Choose a scale that uses most of the grid: pick a simple step such as 1, 2, 5 or 10 units per major square so intermediate values are easy to read, and keep the step constant along the whole axis. Start each axis at zero unless the data range makes that wasteful, in which case a clear break may be shown. Number the major gridlines rather than every small square, and give the graph a title stating what is plotted. A strong answer earns marks for these points. Identifies the independent variable and places it on the x-axis, with the dependent variable on the y-axis. States that each axis label must give the quantity and its unit, e.g. 'Concentration / mol dm⁻³'. Explains that a constant, simple scale step (such as 1, 2, 5 or 10 per major square) makes values easy to read. Recognises that the scale should use most of the available grid so plotted points are spread out and readable. A common slip: Putting the dependent variable on the x-axis. Instead, the variable the experimenter sets or controls goes on the x-axis and the measured outcome on the y-axis. Exam tip: Read the axis labels in the question stem before answering; the quantity and unit must both be present.
See it
Key words
Say what each word means before you turn the card.
Independent variable
Try answering aloud or in your head before turning the card.
Dependent variable
Try answering aloud or in your head before turning the card.
Axis labelling with quantity and unit
Try answering aloud or in your head before turning the card.
Constant, readable scale choice
Try answering aloud or in your head before turning the card.
See every definition
- Independent variable
- The variable you chose or controlled, which is placed on the x-axis.
- Dependent variable
- The variable that is placed on the y-axis.
- Axis labelling with quantity and unit
- Each axis is labelled with the quantity and its unit, using a solidus or brackets so the unit is unambiguous.
- Constant, readable scale choice
- A simple step such as 1, 2, 5 or 10 units per major square, kept constant along the whole axis, makes intermediate values easy to read.
Label the diagram
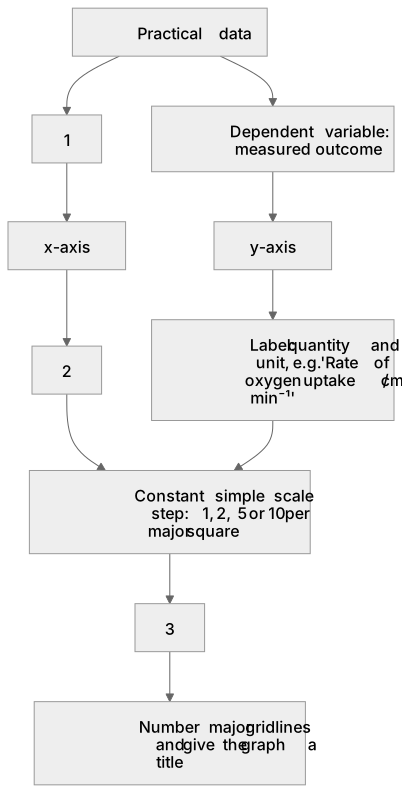
Some boxes have lost their names. Pick the right name for each number.
1Box 1
2Box 2
3Box 3
There is more to this lesson
The full lesson goes on to check your understanding and help you earn the marks. Create a free account to carry on, with your progress saved.
A week of Premium from your first lesson · Then the free plan continues · No card, no charge
Test your understanding of Analysis: (i) selection and labelling of axes with appropriate scales, quantities and units
Active recall beats re-reading. Take an instant quiz now to test what you’ve learned and lock it into long-term memory.
A week of Premium from your first lesson · Then the free plan continues · No card, no charge