OCR · A-Level · Biology
Course version: H420 · Version from Sept 2025
(d) the use and interpretation of Simpson’s Index of Diversity (D) to…
Full specification wording
Biodiversity: (d) the use and interpretation of Simpson’s Index of Diversity (D) to calculate the biodiversity of a habitat
Simpson's Index of Diversity (D) combines species richness and evenness into a single measure of biodiversity.
Checked against the OCR H420 specification (opens in a new tab) on .
- Point 5 of 10
- 4 key terms
Study notes
From the checked teaching notes for this specification point.
The idea
Simpson's Index of Diversity (D) combines species richness and evenness into a single measure of biodiversity. Using the form D = 1 − Σ(n/N)², where n is the number of individuals of each species and N is the total number of individuals of all species, you square each species' proportion, sum these values and subtract from 1. A value close to 1 indicates high diversity (many species, fairly even abundances); a value close to 0 indicates low diversity (few species or one dominant species). To use it, sample the habitat representatively, count individuals of each species, calculate N, then apply the formula. Interpretation must consider that D depends on both richness and evenness, and that sampling bias or small samples reduce reliability.
What earns the marks
- Simpson's Index of Diversity combines species richness and species evenness into one value describing habitat biodiversity.
- The formula is D = 1 − Σ(n/N)², where n is the number of individuals of a species and N is the total number of individuals of all species.
- Each species' proportion (n/N) is squared, the squared values are summed, and the sum is subtracted from 1.
- A value of D close to 1 indicates high biodiversity; a value close to 0 indicates low biodiversity.
- D depends on both the number of species and how evenly individuals are distributed among them.
- Representative sampling and adequate sample size are needed for a reliable value of D.
Common mistakes and how to put them right
Forgetting to subtract the sum from 1, which reverses the meaning of the index.
Using n as the total and N as a single species count, rather than n for one species and N for the total.
Treating a high D as meaning few species.
Put it right: High D reflects many species with even abundances.
Exam tips
- Write the formula clearly as D = 1 − Σ(n/N)² and define n and N before substituting values.
- Check the direction of interpretation: values near 1 mean high diversity, values near 0 mean low diversity.
- Explain that D reflects both richness and evenness when interpreting a calculated value.
Try the lesson
The start of the Biodiversity: (d) the use and interpretation of Simpson’s Index of Diversity (D) to calculate the biodiversity of a habitat lesson, made from checked teaching notes for this specification point.
Have a go first
A habitat has a Simpson's Index of Diversity (D) of 0.9. What does this value indicate about the habitat?
Listen
Simpson's Index of Diversity (D) combines species richness and evenness into a single measure of biodiversity. Using the form D = 1 − Σ(n/N)², where n is the number of individuals of each species and N is the total number of individuals of all species, you square each species' proportion, sum these values and subtract from 1. A value close to 1 indicates high diversity (many species, fairly even abundances); a value close to 0 indicates low diversity (few species or one dominant species). To use it, sample the habitat representatively, count individuals of each species, calculate N, then apply the formula. Interpretation must consider that D depends on both richness and evenness, and that sampling bias or small samples reduce reliability. A strong answer earns marks for these points. Simpson's Index of Diversity combines species richness and species evenness into one value describing habitat biodiversity. The formula is D = 1 − Σ(n/N)², where n is the number of individuals of a species and N is the total number of individuals of all species. Each species' proportion (n/N) is squared, the squared values are summed, and the sum is subtracted from 1. A value of D close to 1 indicates high biodiversity; a value close to 0 indicates low biodiversity. Exam tip: Write the formula clearly as D = 1 − Σ(n/N)² and define n and N before substituting values.
See it
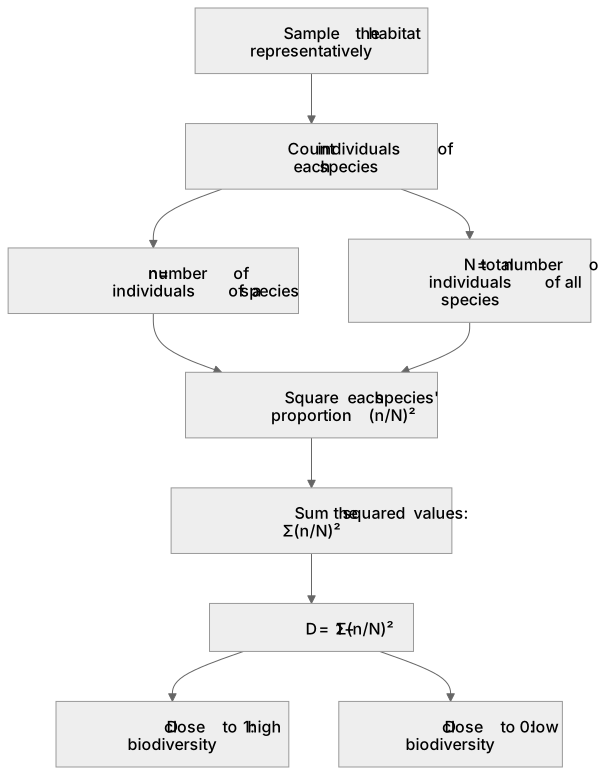
Key words
Say what each word means before you turn the card.
Simpson's Index formula
Try answering aloud or in your head before turning the card.
Richness and evenness combined
Try answering aloud or in your head before turning the card.
Interpreting D values
Try answering aloud or in your head before turning the card.
Sampling reliability
Try answering aloud or in your head before turning the card.
See every definition
- Simpson's Index formula
- D = 1 − Σ(n/N)², where n is the number of individuals of each species and N is the total number of individuals of all species.
- Richness and evenness combined
- D depends on both the number of species and how evenly individuals are distributed among them.
- Interpreting D values
- A value close to 1 indicates high biodiversity; a value close to 0 indicates low biodiversity.
- Sampling reliability
- Representative sampling and adequate sample size are needed for a reliable value of D.
Label the diagram
Some boxes have lost their names. Pick the right name for each number.
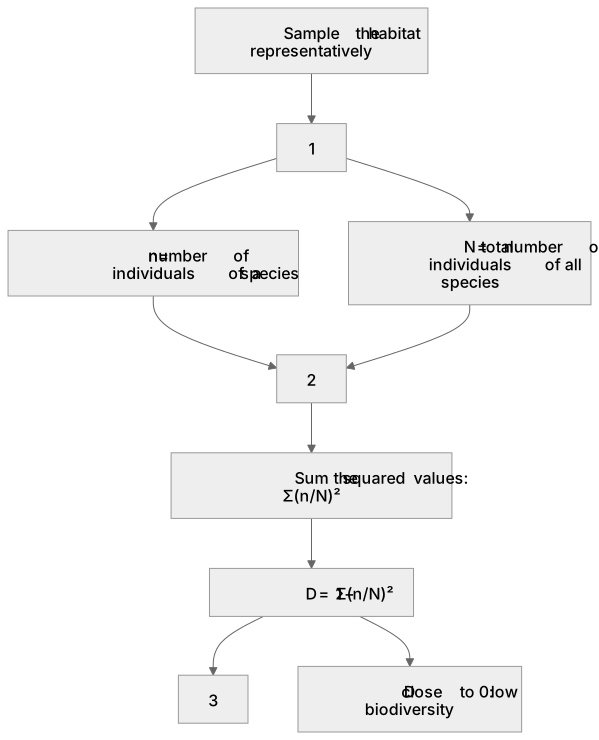
1Box 1
2Box 2
3Box 3
There is more to this lesson
The full lesson goes on to check your understanding and help you earn the marks. Create a free account to carry on, with your progress saved.
A week of Premium from your first lesson · Then the free plan continues · No card, no charge
Test your understanding of Biodiversity: (d) the use and interpretation of Simpson’s Index of Diversity (D) to calculate the biodiversity of a habitat
Active recall beats re-reading. Take an instant quiz now to test what you’ve learned and lock it into long-term memory.
A week of Premium from your first lesson · Then the free plan continues · No card, no charge