OCR · A-Level · Biology
Course version: H420 · Version from Sept 2025
(ii) the use of sampling and recording methods to determine the…
Full specification wording
Ecosystems: (ii) the use of sampling and recording methods to determine the distribution and abundance of organisms in a variety of ecosystems.
Sampling estimates organisms without counting everything.
Checked against the OCR H420 specification (opens in a new tab) on .
- Point 6 of 6
- 4 key terms
Study notes
From the checked teaching notes for this specification point.
The idea
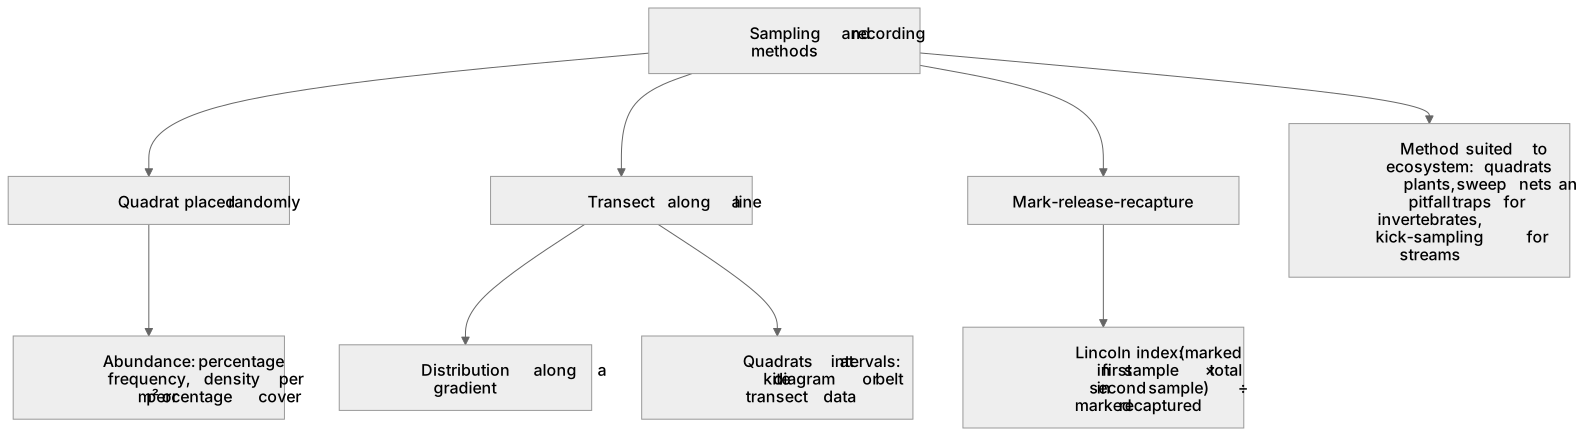
Sampling estimates organisms without counting everything. Distribution is where organisms occur; abundance is how many or how much. In a habitat, a quadrat placed randomly (for example using random coordinates) gives percentage frequency, density per m² or percentage cover. A transect records how distribution changes along a line, with quadrats at intervals giving a kite diagram or belt transect data. For mobile animals, mark-release-recapture estimates population size using the Lincoln index: estimated population = (number marked in first sample × total in second sample) ÷ number of marked recaptured. Methods must be appropriate to the ecosystem: quadrats suit plants and slow-moving organisms on rocky shores or grassland; sweep nets and pitfall traps suit invertebrates; kick-sampling suits streams. Random sampling avoids bias, and sufficient samples improve reliability.
What earns the marks
- States that quadrats estimate abundance (frequency, density or percentage cover) and transects show distribution along a gradient.
- Explains that random placement of quadrats reduces bias, and that larger numbers of samples improve reliability.
- Applies the Lincoln index correctly: estimated population = (marked in first sample × total in second sample) ÷ marked recaptured.
- Selects a method suited to the ecosystem, for example quadrats for plants on a rocky shore, pitfall traps for ground invertebrates, or kick-sampling for stream organisms.
- Recognises that consistent recording (same quadrat size, same cover scale) allows valid comparison between ecosystems.
Common mistakes and how to put them right
Thinking a single quadrat gives the abundance of the whole habitat.
Put it right: Many randomly placed quadrats are needed to estimate the population.
Confusing distribution with abundance.
Put it right: Distribution is where organisms are found, abundance is how many or how much.
Using mark-release-recapture for plants.
Put it right: It suits mobile animals, while quadrats suit plants and sessile organisms.
Exam tips
- Read the ecosystem named in the question and choose a sampling method that physically suits it before calculating anything.
- When using the Lincoln index, keep the two samples distinct and substitute values carefully, checking the arithmetic.
- Link each method to whether it measures distribution (transect) or abundance (quadrat counts, cover estimates).
Try the lesson
The start of the Ecosystems: (ii) the use of sampling and recording methods to determine the distribution and abundance of organisms in a variety of ecosystems. lesson, made from checked teaching notes for this specification point.
Have a go first
A student places 10 quadrats, each 0.5 m², in a meadow and counts a total of 40 buttercups. The meadow has an area of 200 m². Estimate the total number of buttercups in the meadow.
Listen
Sampling estimates organisms without counting everything. Distribution is where organisms occur; abundance is how many or how much. In a habitat, a quadrat placed randomly (for example using random coordinates) gives percentage frequency, density per m² or percentage cover. A transect records how distribution changes along a line, with quadrats at intervals giving a kite diagram or belt transect data. For mobile animals, mark-release-recapture estimates population size using the Lincoln index: estimated population = (number marked in first sample × total in second sample) ÷ number of marked recaptured. Methods must be appropriate to the ecosystem: quadrats suit plants and slow-moving organisms on rocky shores or grassland; sweep nets and pitfall traps suit invertebrates; kick-sampling suits streams. Random sampling avoids bias, and sufficient samples improve reliability. A strong answer earns marks for these points. States that quadrats estimate abundance (frequency, density or percentage cover) and transects show distribution along a gradient. Explains that random placement of quadrats reduces bias, and that larger numbers of samples improve reliability. Applies the Lincoln index correctly: estimated population = (marked in first sample × total in second sample) ÷ marked recaptured. Selects a method suited to the ecosystem, for example quadrats for plants on a rocky shore, pitfall traps for ground invertebrates, or kick-sampling for stream organisms. A common slip: Thinking a single quadrat gives the abundance of the whole habitat. Instead, many randomly placed quadrats are needed to estimate the population. Exam tip: Read the ecosystem named in the question and choose a sampling method that physically suits it before calculating anything.
See it
Key words
Say what each word means before you turn the card.
Random sampling to estimate abundance
Try answering aloud or in your head before turning the card.
Transects to record distribution
Try answering aloud or in your head before turning the card.
Mark-release-recapture for mobile animals
Try answering aloud or in your head before turning the card.
Matching method to ecosystem and consistent recording
Try answering aloud or in your head before turning the card.
See every definition
- Random sampling to estimate abundance
- Placing a quadrat randomly, for example using random coordinates, gives percentage frequency, density per m² or percentage cover, and avoids bias.
- Transects to record distribution
- A line along which distribution changes is recorded, with quadrats at intervals giving a kite diagram or belt transect data.
- Mark-release-recapture for mobile animals
- An estimate of population size using the Lincoln index: estimated population = (number marked in first sample × total in second sample) ÷ number of marked recaptured.
- Matching method to ecosystem and consistent recording
- Quadrats suit plants and slow-moving organisms, sweep nets and pitfall traps suit invertebrates and kick-sampling suits streams, while consistent recording allows valid comparison between ecosystems.
Label the diagram
Some boxes have lost their names. Pick the right name for each number.
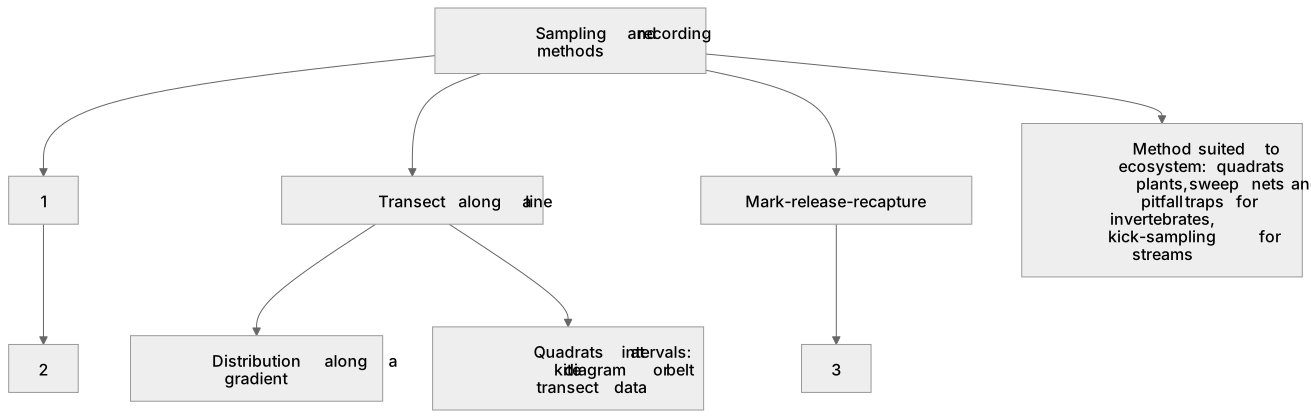
1Box 1
2Box 2
3Box 3
There is more to this lesson
The full lesson goes on to check your understanding and help you earn the marks. Create a free account to carry on, with your progress saved.
A week of Premium from your first lesson · Then the free plan continues · No card, no charge
Test your understanding of Ecosystems: (ii) the use of sampling and recording methods to determine the distribution and abundance of organisms in a variety of ecosystems.
Active recall beats re-reading. Take an instant quiz now to test what you’ve learned and lock it into long-term memory.
A week of Premium from your first lesson · Then the free plan continues · No card, no charge