OCR · A-Level · Biology
Course version: H420 · Version from Sept 2025
(e) (i) how the distribution and abundance of organisms in an ecosystem…
Full specification wording
Ecosystems: (e) (i) how the distribution and abundance of organisms in an ecosystem can be measured
Distribution describes where organisms are found across a habitat, while abundance describes how many there are.
Checked against the OCR H420 specification (opens in a new tab) on .
- Point 5 of 6
- 3 key terms
Study notes
From the checked teaching notes for this specification point.
The idea
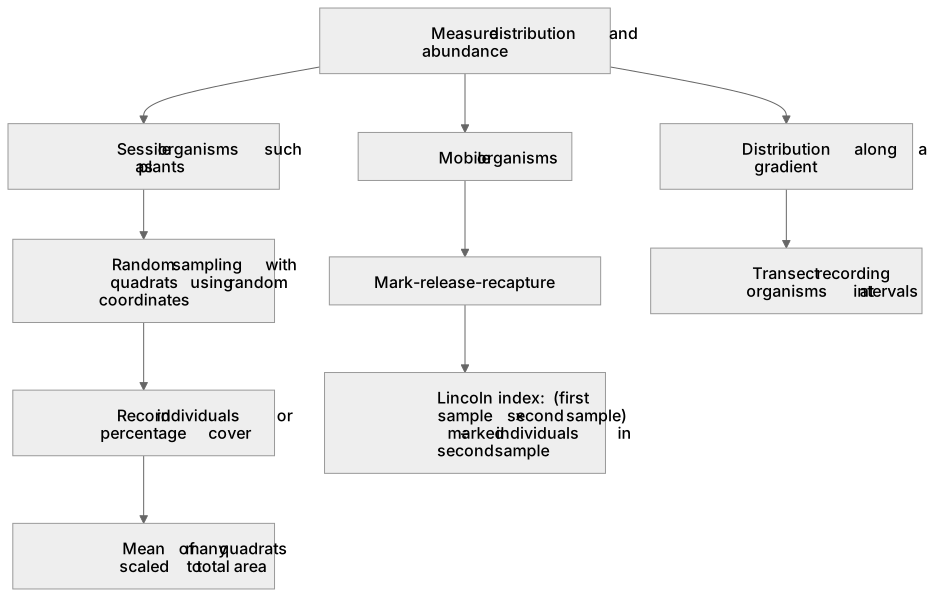
Distribution describes where organisms are found across a habitat, while abundance describes how many there are. Random sampling avoids bias: a quadrat is placed using random coordinates, and the number of individuals or percentage cover of a species is recorded. Percentage cover suits sessile organisms such as plants; counting individuals suits discrete organisms. To estimate abundance across a habitat, many quadrats are sampled and the mean is scaled to the total area. For mobile organisms, mark-release-recapture is used: animals are captured, marked, released, then a second sample is taken, and the Lincoln index estimates population size as (number in first sample × number in second sample) ÷ number of marked individuals in the second sample. Distribution along a gradient is measured using a transect, recording organisms at intervals.
What earns the marks
- Distribution is where organisms are found; abundance is how many there are.
- Random sampling with quadrats uses random coordinates to avoid bias, recording individuals or percentage cover.
- Percentage cover suits sessile organisms such as plants, while counting individuals suits discrete organisms.
- Mean abundance from many quadrats is scaled to the total area to estimate population size.
- Mark-release-recapture estimates mobile populations using the Lincoln index: (first sample × second sample) ÷ marked individuals in the second sample.
- A transect records distribution along a gradient by sampling at intervals.
Common mistakes and how to put them right
Placing quadrats where organisms look abundant.
Put it right by using random coordinates to avoid bias.
Using percentage cover for mobile animals.
Put it right by choosing mark-release-recapture for mobile organisms.
Forgetting to scale the mean to the total area.
Put it right by multiplying the mean per quadrat by the number of quadrats that fit the area.
Assuming every marked animal is recaptured.
Put it right by using the number of marked individuals actually found in the second sample.
Exam tips
- State clearly whether you are measuring distribution or abundance, as the method differs.
- Show the Lincoln index calculation with the correct numerator and denominator.
- Explain why random sampling reduces bias when justifying a method.
Try the lesson
The start of the Ecosystems: (e) (i) how the distribution and abundance of organisms in an ecosystem can be measured lesson, made from checked teaching notes for this specification point.
Have a go first
A student wants to estimate the abundance of daisies in a large meadow without counting every plant. Which method is most appropriate?
Listen
Distribution describes where organisms are found across a habitat, while abundance describes how many there are. Random sampling avoids bias: a quadrat is placed using random coordinates, and the number of individuals or percentage cover of a species is recorded. Percentage cover suits sessile organisms such as plants; counting individuals suits discrete organisms. To estimate abundance across a habitat, many quadrats are sampled and the mean is scaled to the total area. For mobile organisms, mark-release-recapture is used: animals are captured, marked, released, then a second sample is taken, and the Lincoln index estimates population size as (number in first sample × number in second sample) ÷ number of marked individuals in the second sample. Distribution along a gradient is measured using a transect, recording organisms at intervals. A strong answer earns marks for these points. Distribution is where organisms are found; abundance is how many there are. Random sampling with quadrats uses random coordinates to avoid bias, recording individuals or percentage cover. Percentage cover suits sessile organisms such as plants, while counting individuals suits discrete organisms. Mean abundance from many quadrats is scaled to the total area to estimate population size. A common slip: Placing quadrats where organisms look abundant. Instead, using random coordinates to avoid bias. Exam tip: State clearly whether you are measuring distribution or abundance, as the method differs.
See it
Key words
Say what each word means before you turn the card.
Distribution versus abundance
Try answering aloud or in your head before turning the card.
Random quadrat sampling
Try answering aloud or in your head before turning the card.
Transects along gradients
Try answering aloud or in your head before turning the card.
See every definition
- Distribution versus abundance
- Distribution describes where organisms are found across a habitat, while abundance describes how many there are.
- Random quadrat sampling
- A quadrat is placed using random coordinates to avoid bias, and the number of individuals or percentage cover of a species is recorded.
- Transects along gradients
- Distribution along a gradient is measured using a transect, recording organisms at intervals.
Label the diagram
Some boxes have lost their names. Pick the right name for each number.
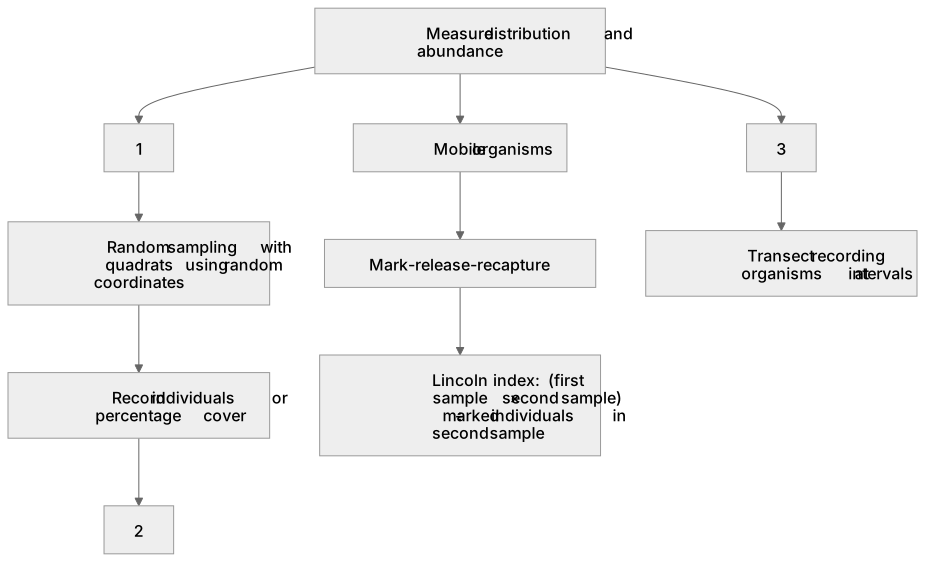
1Box 1
2Box 2
3Box 3
There is more to this lesson
The full lesson goes on to check your understanding and help you earn the marks. Create a free account to carry on, with your progress saved.
A week of Premium from your first lesson · Then the free plan continues · No card, no charge
Test your understanding of Ecosystems: (e) (i) how the distribution and abundance of organisms in an ecosystem can be measured
Active recall beats re-reading. Take an instant quiz now to test what you’ve learned and lock it into long-term memory.
A week of Premium from your first lesson · Then the free plan continues · No card, no charge