OCR · A-Level · Biology
Course version: H420 · Version from Sept 2025
Evaluation: (b) the identification of anomalies in experimental measurements
An anomaly is a measurement that does not fit the pattern shown by the other readings.
Checked against the OCR H420 specification (opens in a new tab) on .
- Point 1 of 2
- 4 key terms
Study notes
From the checked teaching notes for this specification point.
The idea
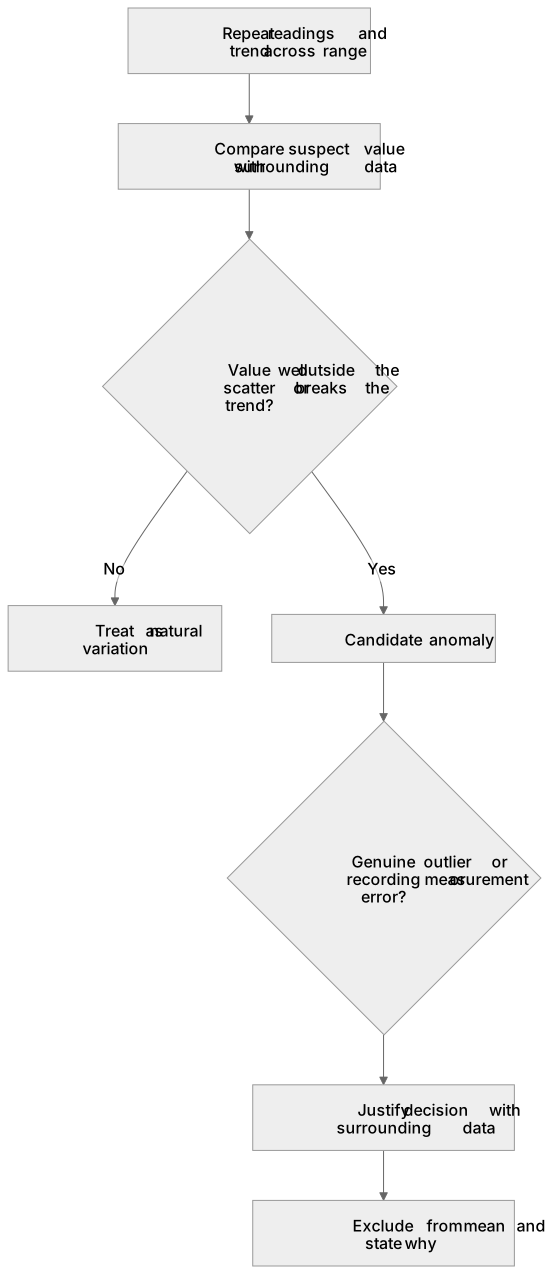
An anomaly is a measurement that does not fit the pattern shown by the other readings. To identify one, first look at the spread of the repeat readings and the trend across the range tested. A value lying well outside the scatter of the others, or breaking a clear trend, is a candidate anomaly. Decide whether it is a genuine outlier or a recording or measurement error, and justify your decision with the surrounding data. For example, if triplicate readings are 12, 13 and 31 arbitrary units, the value 31 is far from the others and is likely anomalous. Anomalies are normally excluded from a mean, but you should state why. Distinguish an anomaly from natural variation: small scatter is expected, whereas a single value far outside the pattern is not.
What earns the marks
- Defines an anomaly as a measurement that does not fit the pattern of the other readings.
- Compares a suspect value with the surrounding repeats or trend to justify calling it anomalous.
- Distinguishes an anomaly from ordinary random variation within the expected scatter.
- Explains that anomalous values are usually excluded from a mean and gives a reason.
- Recognises that an apparent anomaly may indicate a recording or measurement error rather than a true result.
Common mistakes and how to put them right
Calling any value that differs slightly from the others an anomaly.
Put it right: Compare it with the overall scatter and only flag values well outside the pattern.
Including an anomalous value in a mean without comment.
Put it right: Exclude it and state the reason.
Assuming an anomaly is always a mistake.
Put it right: Consider that it may be a genuine result and to justify the decision with evidence.
Exam tips
- Compare the suspect value with the other repeats and with the trend across the range before deciding.
- State the reason for excluding a value, referring to the surrounding data.
- Check units and significant figures when judging whether a value fits the pattern.
Try the lesson
The start of the Evaluation: (b) the identification of anomalies in experimental measurements lesson, made from checked teaching notes for this specification point.
Have a go first
A student records the following times for a reaction: 12 s, 13 s, 12 s, 47 s, 13 s. Which reading is an anomaly?
Listen
An anomaly is a measurement that does not fit the pattern shown by the other readings. To identify one, first look at the spread of the repeat readings and the trend across the range tested. A value lying well outside the scatter of the others, or breaking a clear trend, is a candidate anomaly. Decide whether it is a genuine outlier or a recording or measurement error, and justify your decision with the surrounding data. For example, if triplicate readings are 12, 13 and 31 arbitrary units, the value 31 is far from the others and is likely anomalous. Anomalies are normally excluded from a mean, but you should state why. Distinguish an anomaly from natural variation: small scatter is expected, whereas a single value far outside the pattern is not. A strong answer earns marks for these points. Defines an anomaly as a measurement that does not fit the pattern of the other readings. Compares a suspect value with the surrounding repeats or trend to justify calling it anomalous. Distinguishes an anomaly from ordinary random variation within the expected scatter. Explains that anomalous values are usually excluded from a mean and gives a reason. A common slip: Calling any value that differs slightly from the others an anomaly. Instead, compare it with the overall scatter and only flag values well outside the pattern. Exam tip: Compare the suspect value with the other repeats and with the trend across the range before deciding.
See it
Key words
Say what each word means before you turn the card.
Anomaly
Try answering aloud or in your head before turning the card.
Comparing values with repeats and trends
Try answering aloud or in your head before turning the card.
Anomalies versus random variation
Try answering aloud or in your head before turning the card.
Excluding anomalous values from means
Try answering aloud or in your head before turning the card.
See every definition
- Anomaly
- A measurement that does not fit the pattern shown by the other readings.
- Comparing values with repeats and trends
- Looking at the spread of the repeat readings and the trend across the range tested to identify a candidate anomaly.
- Anomalies versus random variation
- Small scatter is expected, whereas a single value far outside the pattern is not.
- Excluding anomalous values from means
- Anomalies are normally excluded from a mean, but you should state why.
Label the diagram
Some boxes have lost their names. Pick the right name for each number.
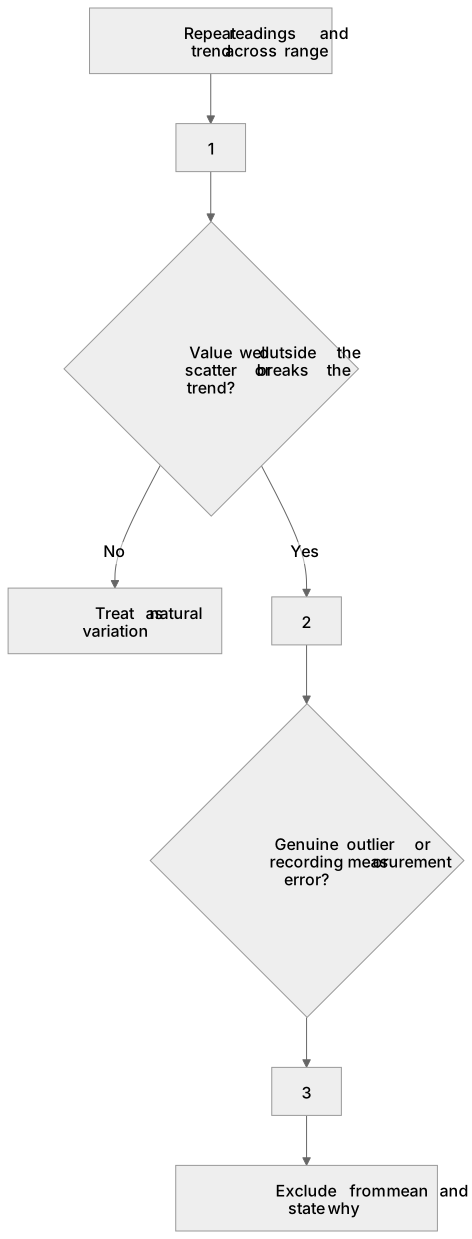
1Box 1
2Box 2
3Box 3
There is more to this lesson
The full lesson goes on to check your understanding and help you earn the marks. Create a free account to carry on, with your progress saved.
A week of Premium from your first lesson · Then the free plan continues · No card, no charge
Test your understanding of Evaluation: (b) the identification of anomalies in experimental measurements
Active recall beats re-reading. Take an instant quiz now to test what you’ve learned and lock it into long-term memory.
A week of Premium from your first lesson · Then the free plan continues · No card, no charge