OCR · A-Level · Biology
Course version: H420 · Version from Sept 2025
(f) present information and data in a scientific way
Full specification wording
Practical skills - Use and application of scientific methods and practices: (f) present information and data in a scientific way
Presenting information and data scientifically means choosing a format that matches the data and lets a reader extract values quickly and without ambiguity.
Checked against the OCR H420 specification (opens in a new tab) on .
- Point 2 of 2
- 4 key terms
Study notes
From the checked teaching notes for this specification point.
The idea
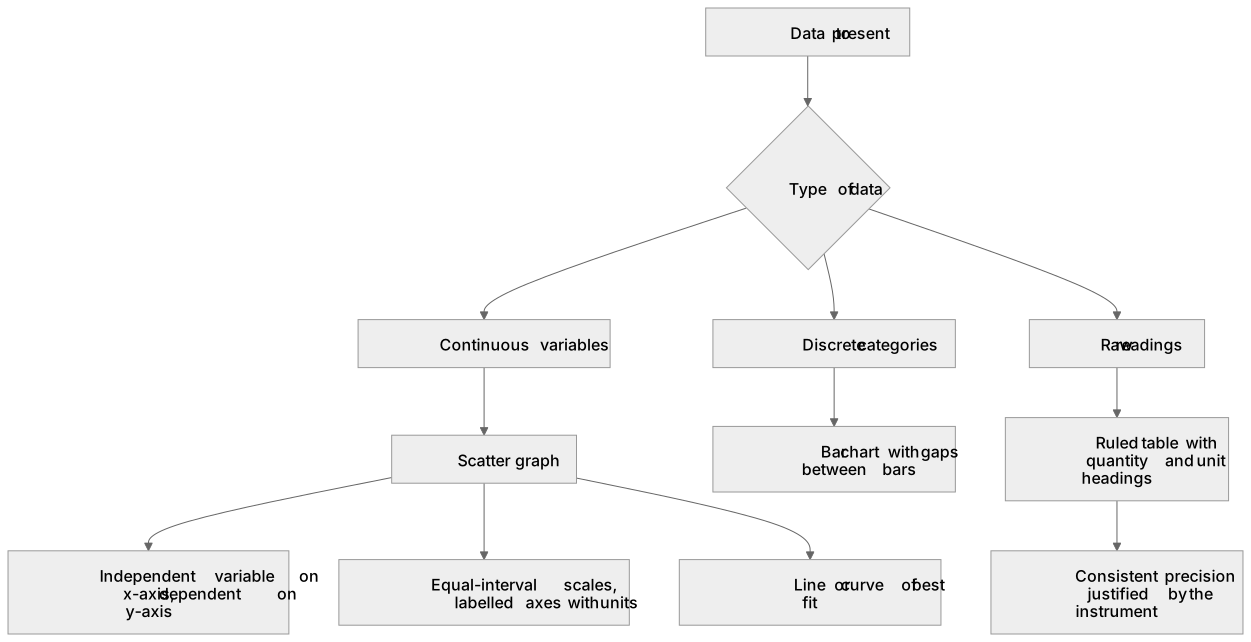
Presenting information and data scientifically means choosing a format that matches the data and lets a reader extract values quickly and without ambiguity. For continuous variables, such as time against volume of gas evolved, plot a scatter graph with the independent variable on the x-axis, the dependent variable on the y-axis, equal-interval scales, labelled axes with units, and a line or curve of best fit. For discrete categories, use a bar chart with gaps between bars. Record raw readings in a ruled table with a clear heading for each column giving quantity and unit, and keep the same number of decimal places or significant figures as the measuring instrument justifies. Label any diagram, add a title, and state units on every axis. A scientific presentation is judged on clarity, correct units, sensible scale choice and accurate plotting, not decoration.
What earns the marks
- Selects a presentation format that matches the data type: scatter graph for continuous variables, bar chart for discrete categories, table for raw readings.
- Labels axes or column headings with both the quantity and its unit, and gives the graph or table a title.
- Uses an even, clearly numbered scale that fills the available space and plots points accurately.
- Records readings to a consistent precision justified by the measuring instrument and does not overstate significant figures.
- Draws an appropriate line or curve of best fit rather than joining every point dot-to-dot.
Common mistakes and how to put them right
Joining every plotted point with straight lines instead of drawing a line or curve of best fit.
Put it right: Use best fit to show the trend, recognising scatter.
Omitting units from axis labels or column headings.
Put it right: State quantity and unit together, for example time / s.
Using a bar chart for continuous data or a scatter graph for categories.
Put it right: Match the chart type to whether the variable is continuous or discrete.
Exam tips
- Read the question's data type first, then decide the chart before writing anything.
- Check every axis and heading has a unit before you finish; missing units lose presentation marks.
- Use a sharp pencil and a ruler for axes and best-fit lines so plotting is accurate.
Try the lesson
The start of the Practical skills - Use and application of scientific methods and practices: (f) present information and data in a scientific way lesson, made from checked teaching notes for this specification point.
Have a go first
A student records the volume of oxygen produced by pondweed in a table. Which column heading is presented in the most scientific way?
Listen
Presenting information and data scientifically means choosing a format that matches the data and lets a reader extract values quickly and without ambiguity. For continuous variables, such as time against volume of gas evolved, plot a scatter graph with the independent variable on the x-axis, the dependent variable on the y-axis, equal-interval scales, labelled axes with units, and a line or curve of best fit. For discrete categories, use a bar chart with gaps between bars. Record raw readings in a ruled table with a clear heading for each column giving quantity and unit, and keep the same number of decimal places or significant figures as the measuring instrument justifies. Label any diagram, add a title, and state units on every axis. A scientific presentation is judged on clarity, correct units, sensible scale choice and accurate plotting, not decoration. A strong answer earns marks for these points. Selects a presentation format that matches the data type: scatter graph for continuous variables, bar chart for discrete categories, table for raw readings. Labels axes or column headings with both the quantity and its unit, and gives the graph or table a title. Uses an even, clearly numbered scale that fills the available space and plots points accurately. Records readings to a consistent precision justified by the measuring instrument and does not overstate significant figures. A common slip: Joining every plotted point with straight lines instead of drawing a line or curve of best fit. Instead, use best fit to show the trend, recognising scatter. Exam tip: Read the question's data type first, then decide the chart before writing anything.
See it
Key words
Say what each word means before you turn the card.
Data presentation formats
Try answering aloud or in your head before turning the card.
Units and labelling
Try answering aloud or in your head before turning the card.
Scale and accuracy
Try answering aloud or in your head before turning the card.
Lines and curves of best fit
Try answering aloud or in your head before turning the card.
See every definition
- Data presentation formats
- A scatter graph is used for continuous variables, a bar chart with gaps between bars for discrete categories, and a ruled table for raw readings.
- Units and labelling
- Axes or column headings give both the quantity and its unit, every axis states units, and the graph or table has a title.
- Scale and accuracy
- An even, clearly numbered scale fills the available space, points are plotted accurately, and readings are recorded to a consistent precision justified by the measuring instrument.
- Lines and curves of best fit
- An appropriate line or curve of best fit shows the trend, recognising scatter, rather than joining every plotted point dot-to-dot.
Label the diagram
Some boxes have lost their names. Pick the right name for each number.
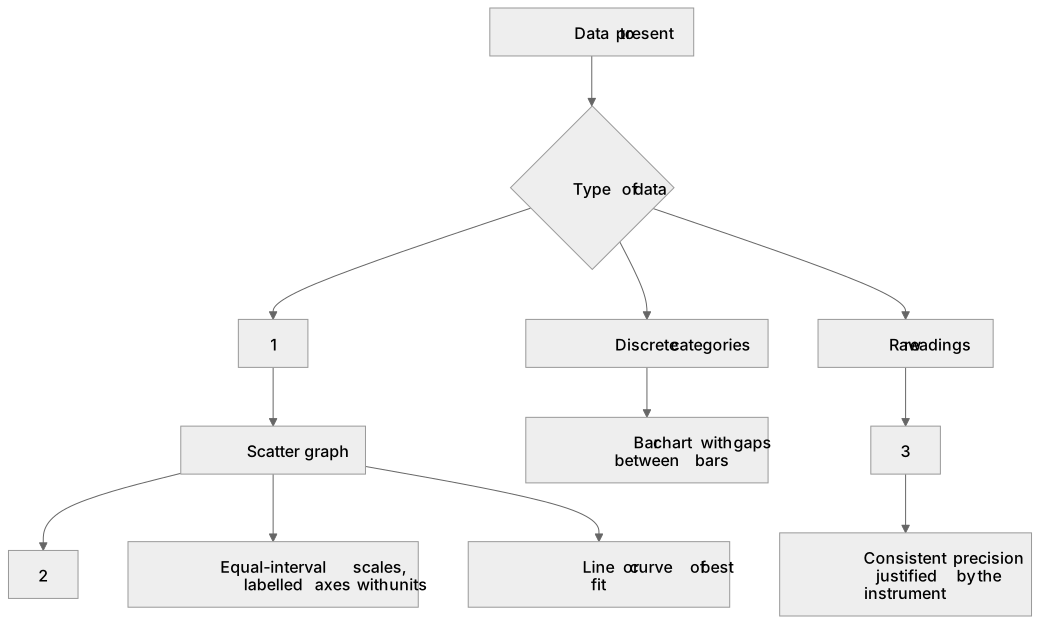
1Box 1
2Box 2
3Box 3
There is more to this lesson
The full lesson goes on to check your understanding and help you earn the marks. Create a free account to carry on, with your progress saved.
A week of Premium from your first lesson · Then the free plan continues · No card, no charge
Test your understanding of Practical skills - Use and application of scientific methods and practices: (f) present information and data in a scientific way
Active recall beats re-reading. Take an instant quiz now to test what you’ve learned and lock it into long-term memory.
A week of Premium from your first lesson · Then the free plan continues · No card, no charge