AQA · GCSE · Business
Course version: 8132 · Version from Sept 2017
Interpretation of data given on financial statements
Full specification wording
Analysing the financial performance of a business: Interpretation of data given on financial statements
Interpretation means reading the figures on financial statements and drawing conclusions about performance and position.
Checked against the AQA 8132 specification (opens in a new tab) on .
- Point 3 of 9
- 4 key terms
Study notes
From the checked teaching notes for this specification point.
The idea
Interpretation means reading the figures on financial statements and drawing conclusions about performance and position. A student selects relevant data, calculates or compares figures, and explains what the result suggests. For example, if revenue rises from £150 000 to £180 000 while cost of sales rises from £90 000 to £120 000, gross profit stays at £60 000, so the gross profit margin falls from 40% to 33.3%; the interpretation is that sales grew but profitability weakened because costs rose in step. Interpretation also covers liquidity, such as comparing current assets with current liabilities, and gearing, such as comparing non-current liabilities with total equity. Conclusions must be supported by the figures and linked to the business context.
What earns the marks
- Selects relevant figures from the income statement or statement of financial position rather than quoting the whole statement.
- Calculates a meaningful measure, such as gross profit margin, using the correct figures and units.
- Compares figures across two years or between businesses to identify a trend or difference.
- Explains what the calculated or compared figure suggests about performance or position, for example that a falling margin indicates rising costs relative to revenue.
- Uses the business context, such as its sector or size, to judge whether a figure is strong or weak.
- Reaches a supported conclusion that weighs the evidence rather than describing figures only.
Common mistakes and how to put them right
Describing what has happened without explaining why it matters.
Put it right: Add a consequence, such as a falling margin reducing the funds available for investment.
Calculating a percentage change but then interpreting it as a percentage of revenue.
Put it right: Keep the base of each calculation clear and label it.
Assuming a higher figure is always better, for example treating high inventory as positive.
Put it right: Consider the context, since excess inventory ties up cash and may indicate weak sales.
Exam tips
- Quote the figures you use and show the calculation so the interpretation is traceable.
- Structure answers as point, evidence and explanation: state the trend, give the figures, then say what it means for the business.
- When comparing, comment on both the direction of change and its size, and finish with a judgement that answers the question asked.
Try the lesson
The start of the Analysing the financial performance of a business: Interpretation of data given on financial statements lesson, made from checked teaching notes for this specification point.
Have a go first
A business has current assets of £60,000 and current liabilities of £30,000. What does the data on the statement of financial position show about its short-term financial position?
Listen
Interpretation means reading the figures on financial statements and drawing conclusions about performance and position. A student selects relevant data, calculates or compares figures, and explains what the result suggests. For example, if revenue rises from £150 000 to £180 000 while cost of sales rises from £90 000 to £120 000, gross profit stays at £60 000, so the gross profit margin falls from 40% to 33.3%; the interpretation is that sales grew but profitability weakened because costs rose in step. Interpretation also covers liquidity, such as comparing current assets with current liabilities, and gearing, such as comparing non-current liabilities with total equity. Conclusions must be supported by the figures and linked to the business context. A strong answer earns marks for these points. Selects relevant figures from the income statement or statement of financial position rather than quoting the whole statement. Calculates a meaningful measure, such as gross profit margin, using the correct figures and units. Compares figures across two years or between businesses to identify a trend or difference. Explains what the calculated or compared figure suggests about performance or position, for example that a falling margin indicates rising costs relative to revenue. A common slip: Describing what has happened without explaining why it matters. Instead, add a consequence, such as a falling margin reducing the funds available for investment. Exam tip: Quote the figures you use and show the calculation so the interpretation is traceable.
See it
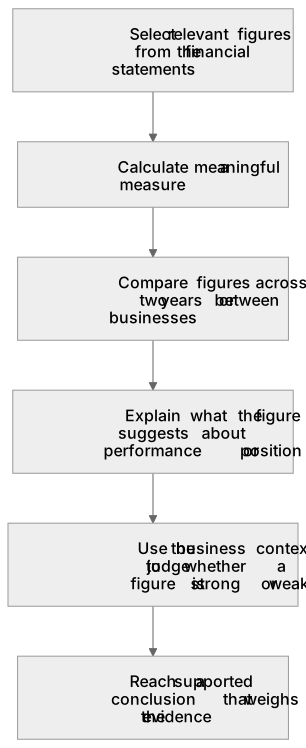
Put it in order
Put these steps in the order they happen.
- 1. Compare figures across two years or between businesses
- 2. Calculate a meaningful measure
- 3. Select relevant figures from the financial statements
- 4. Reach a supported conclusion that weighs the evidence
- 5. Use the business context to judge whether a figure is strong or weak
- 6. Explain what the figure suggests about performance or position
Key words
Say what each word means before you turn the card.
Interpretation
Try answering aloud or in your head before turning the card.
Selecting relevant financial data
Try answering aloud or in your head before turning the card.
Calculating and comparing ratios and totals
Try answering aloud or in your head before turning the card.
Making supported judgements about performance and position
Try answering aloud or in your head before turning the card.
See every definition
- Interpretation
- Reading the figures on financial statements and drawing conclusions about performance and position.
- Selecting relevant financial data
- Choosing relevant figures from the income statement or statement of financial position rather than quoting the whole statement.
- Calculating and comparing ratios and totals
- Calculating a meaningful measure using the correct figures and units, or comparing figures across two years or between businesses to identify a trend or difference.
- Making supported judgements about performance and position
- Reaching a supported conclusion that weighs the evidence and uses both the figures and the business context rather than describing figures only.
Label the diagram
Some boxes have lost their names. Pick the right name for each number.
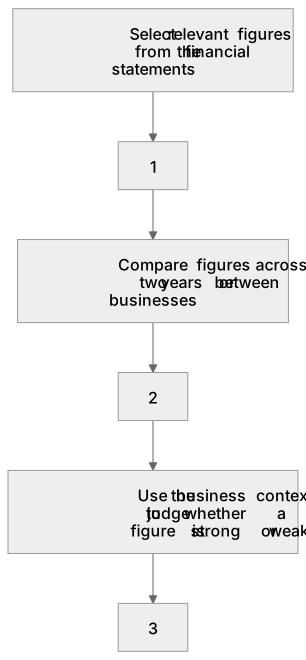
1Box 1
2Box 2
3Box 3
There is more to this lesson
The full lesson goes on to check your understanding and help you earn the marks. Create a free account to carry on, with your progress saved.
A week of Premium from your first lesson · Then the free plan continues · No card, no charge
Test your understanding of Analysing the financial performance of a business: Interpretation of data given on financial statements
Active recall beats re-reading. Take an instant quiz now to test what you’ve learned and lock it into long-term memory.
A week of Premium from your first lesson · Then the free plan continues · No card, no charge