AQA · GCSE · Business
Course version: 8132 · Version from Sept 2017
Identify the break-even level of output and margin of safety from a…
Full specification wording
Financial terms and calculations: identify the break-even level of output and margin of safety from a break-even chart
A break-even chart plots total revenue and total costs against output.
Checked against the AQA 8132 specification (opens in a new tab) on .
- Point 9 of 10
- 3 key terms
Study notes
From the checked teaching notes for this specification point.
The idea
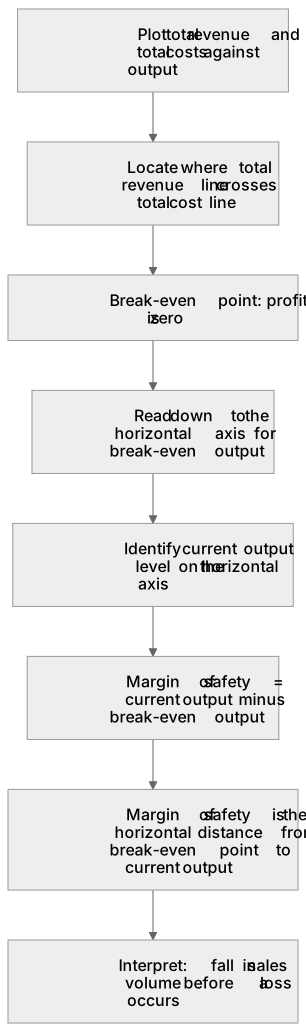
A break-even chart plots total revenue and total costs against output. The break-even level of output is where the total revenue line crosses the total cost line; at this point profit is zero. To identify it, locate the intersection and read down to the x-axis. The margin of safety is the amount by which current output exceeds break-even output. It is calculated as current output minus break-even output. On the chart, it is the horizontal distance from the break-even point to the current output level. For example, if break-even output is 400 units and current output is 550 units, the margin of safety is 150 units. This means sales can fall by 150 units before the business makes a loss. Both figures are read directly from the chart or calculated from it.
What earns the marks
- Locate the point where the total revenue line intersects the total cost line.
- Read the corresponding output value on the horizontal axis to find break-even output.
- Identify current output level on the horizontal axis.
- Calculate margin of safety as current output minus break-even output.
- Interpret margin of safety as the fall in sales volume before a loss occurs.
Common mistakes and how to put them right
Reading the vertical axis instead of the horizontal axis for output.
Put it right: Read output from the x-axis.
Confusing margin of safety with break-even output.
Put it right: Margin of safety is the difference between current output and break-even output.
Assuming margin of safety is always positive.
Put it right: If current output is below break-even, the margin of safety is negative, indicating a loss.
Exam tips
- Annotate the chart clearly: mark the break-even point and label the margin of safety distance.
- Show your calculation for margin of safety, even if the answer is evident from the chart.
- Check units: output is in units, not currency.
Try the lesson
The start of the Financial terms and calculations: identify the break-even level of output and margin of safety from a break-even chart lesson, made from checked teaching notes for this specification point.
Have a go first
On a break-even chart, the total revenue line and the total cost line cross at an output of 400 units. The business is currently selling 550 units. What is the break-even level of output?
Listen
A break-even chart plots total revenue and total costs against output. The break-even level of output is where the total revenue line crosses the total cost line; at this point profit is zero. To identify it, locate the intersection and read down to the x-axis. The margin of safety is the amount by which current output exceeds break-even output. It is calculated as current output minus break-even output. On the chart, it is the horizontal distance from the break-even point to the current output level. For example, if break-even output is 400 units and current output is 550 units, the margin of safety is 150 units. This means sales can fall by 150 units before the business makes a loss. Both figures are read directly from the chart or calculated from it. A strong answer earns marks for these points. Locate the point where the total revenue line intersects the total cost line. Read the corresponding output value on the horizontal axis to find break-even output. Identify current output level on the horizontal axis. Calculate margin of safety as current output minus break-even output. A common slip: Reading the vertical axis instead of the horizontal axis for output. Instead, read output from the x-axis. Exam tip: Annotate the chart clearly: mark the break-even point and label the margin of safety distance.
See it
Put it in order
Put these steps in the order they happen.
- 1. Identify current output level on the horizontal axis
- 2. Interpret: fall in sales volume before a loss occurs
- 3. Margin of safety = current output minus break-even output
- 4. Plot total revenue and total costs against output
- 5. Locate where total revenue line crosses total cost line
- 6. Margin of safety is the horizontal distance from break-even point to current output
- 7. Break-even point: profit is zero
- 8. Read down to the horizontal axis for break-even output
Key words
Say what each word means before you turn the card.
Break-even level of output
Try answering aloud or in your head before turning the card.
Margin of safety
Try answering aloud or in your head before turning the card.
Break-even chart
Try answering aloud or in your head before turning the card.
See every definition
- Break-even level of output
- The level of output where the total revenue line crosses the total cost line, and at this point profit is zero.
- Margin of safety
- The amount by which current output exceeds break-even output, calculated as current output minus break-even output.
- Break-even chart
- A chart that plots total revenue and total costs against output.
Label the diagram
Some boxes have lost their names. Pick the right name for each number.
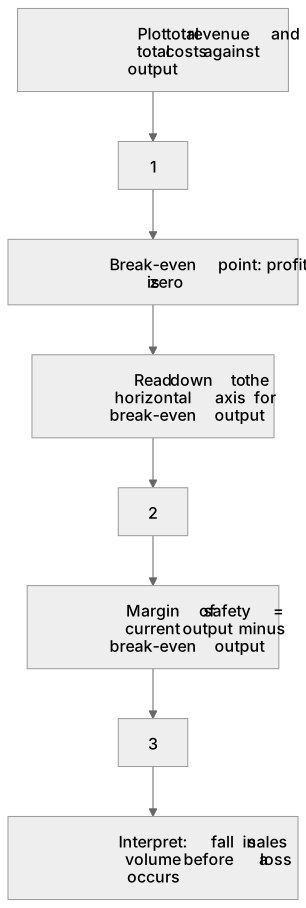
1Box 1
2Box 2
3Box 3
There is more to this lesson
The full lesson goes on to check your understanding and help you earn the marks. Create a free account to carry on, with your progress saved.
A week of Premium from your first lesson · Then the free plan continues · No card, no charge
Test your understanding of Financial terms and calculations: identify the break-even level of output and margin of safety from a break-even chart
Active recall beats re-reading. Take an instant quiz now to test what you’ve learned and lock it into long-term memory.
A week of Premium from your first lesson · Then the free plan continues · No card, no charge