Financial Statements Analysis — OCR A-Level Study Guide
Exam Board: OCR | Level: A-Level
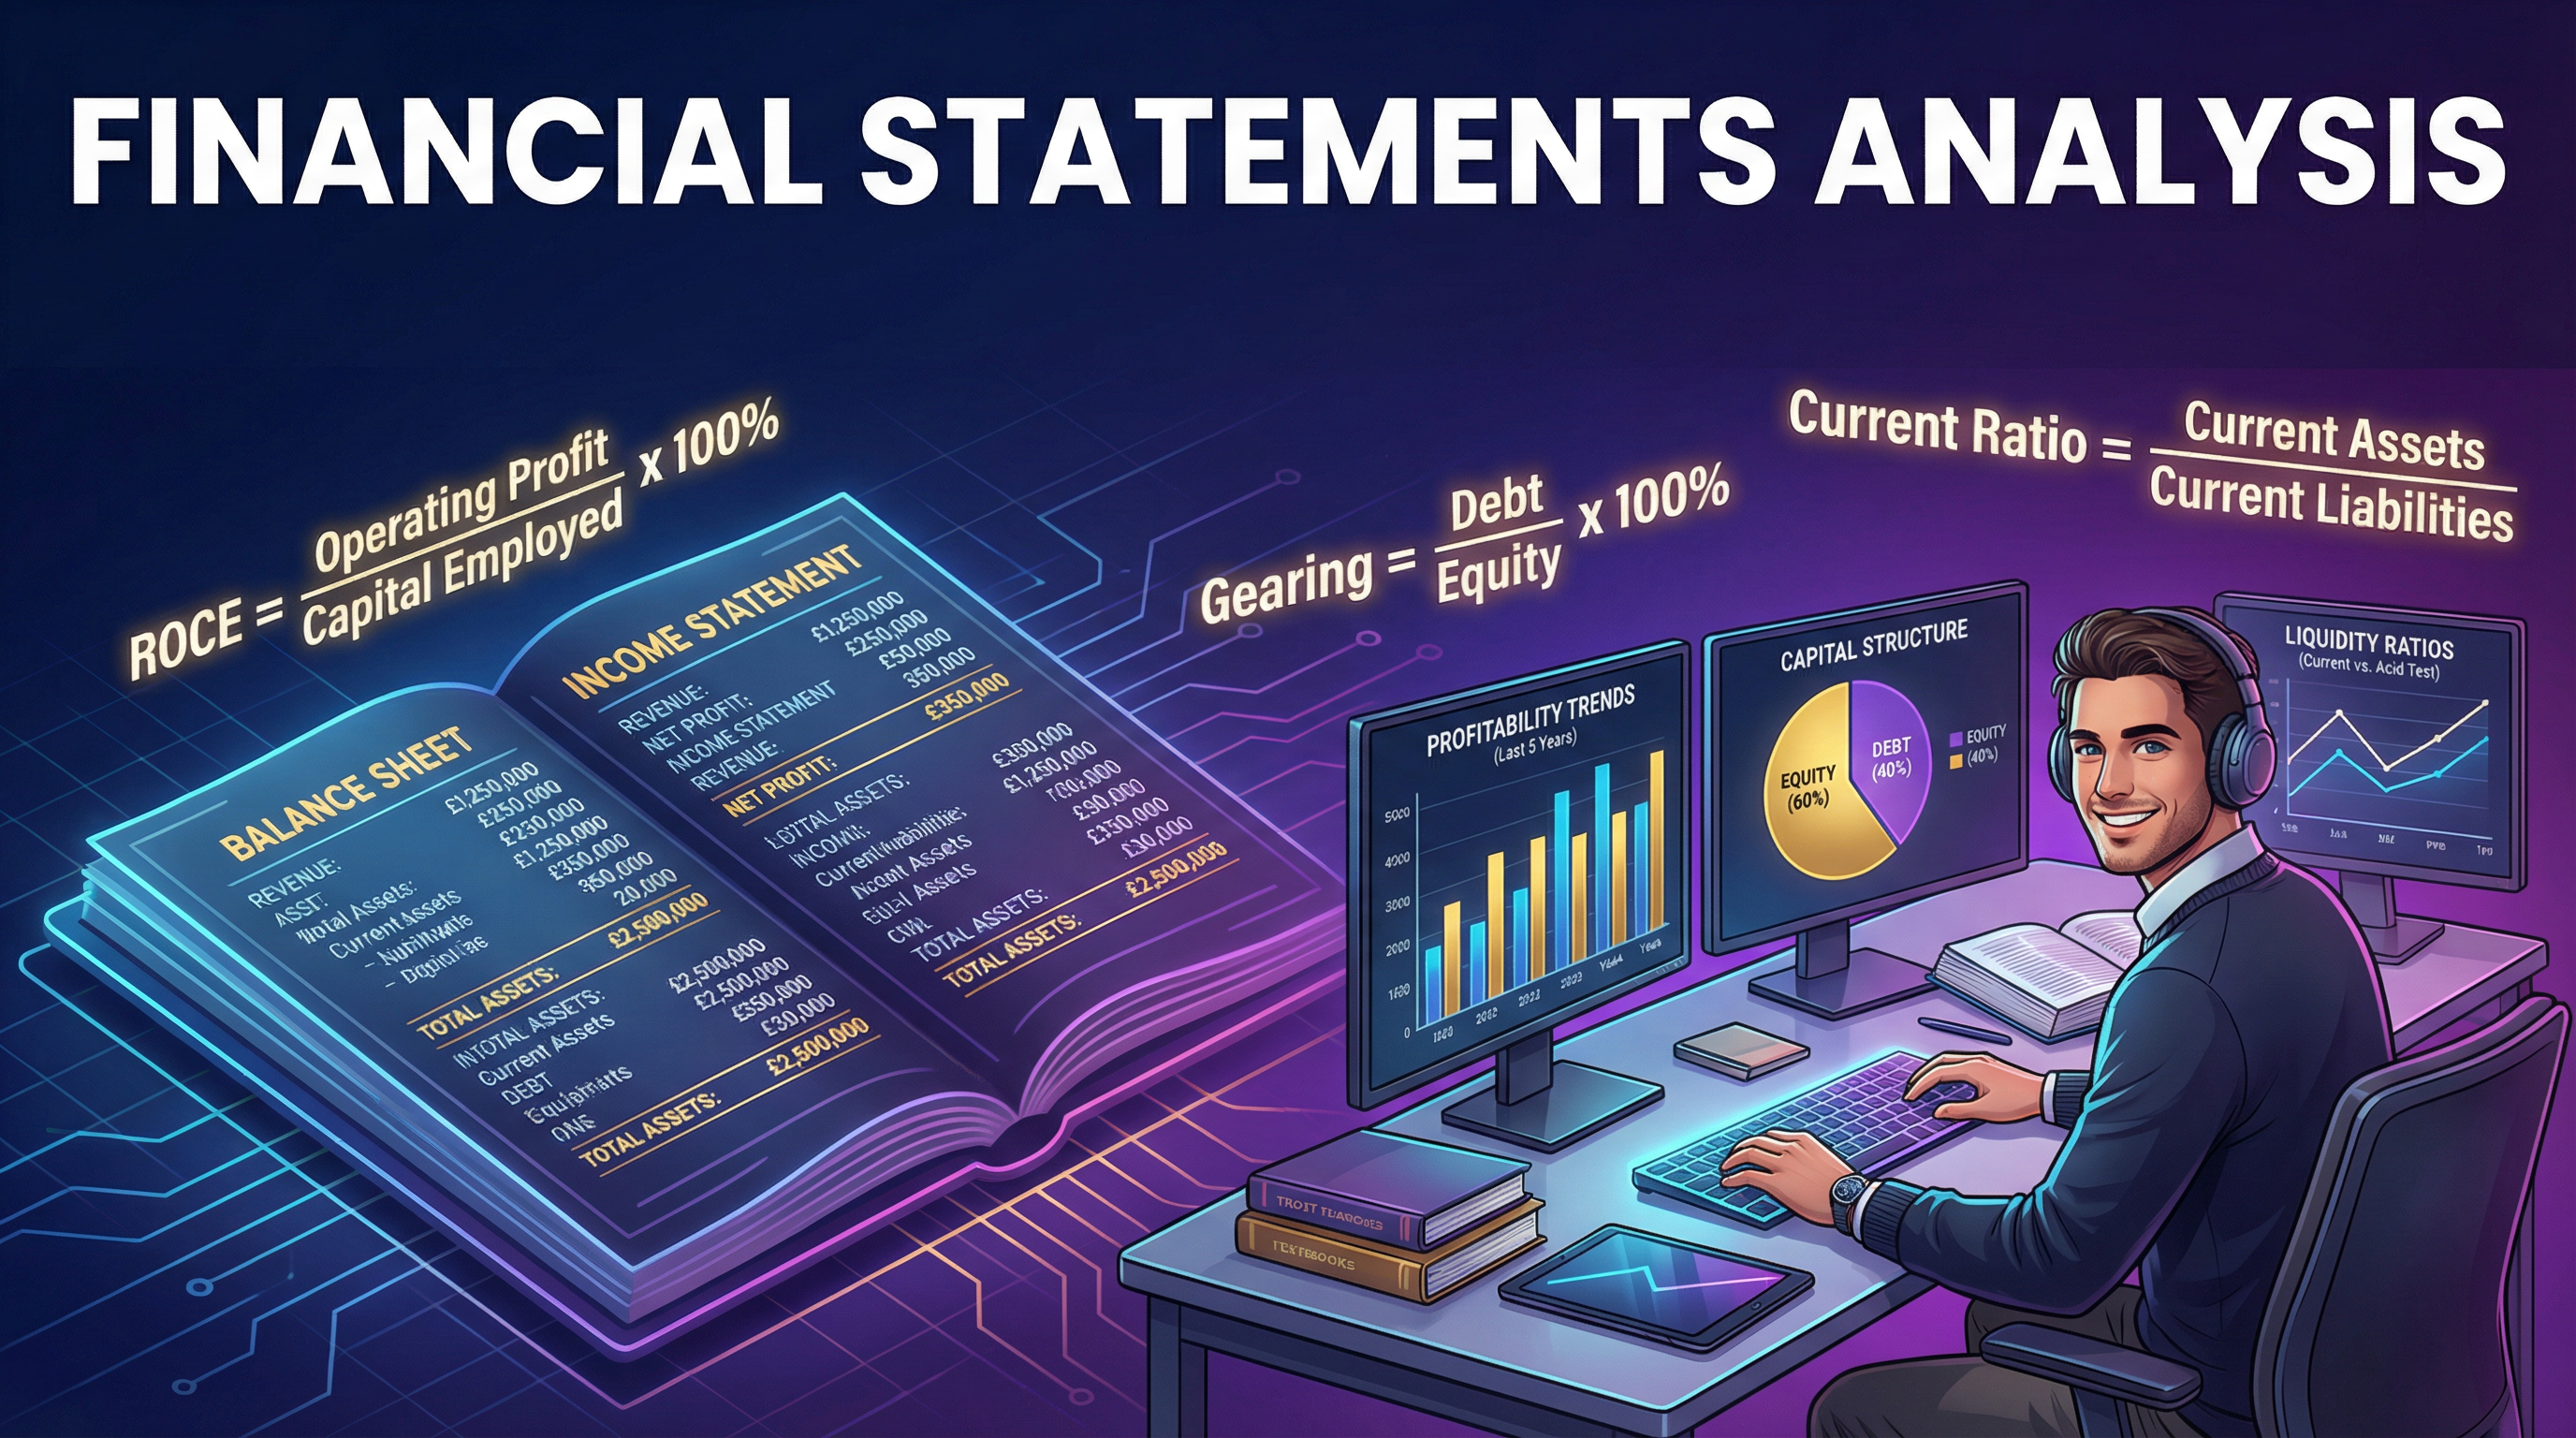
This study guide provides a deep dive into Financial Statements Analysis for OCR A-Level Business. It focuses on transforming raw financial data into powerful strategic insights, helping students move beyond simple calculations to high-level evaluation, which is critical for achieving top marks."
## Overview
Financial Statement Analysis is a cornerstone of the OCR A-Level Business specification. It requires candidates to act as business consultants, dissecting a company's financial health to inform strategic decisions. This is not a simple maths test; it is a test of your ability to interpret, analyse, and evaluate. Examiners are looking for students who can connect the numbers to the narrative of the business provided in the case study. You will be expected to master the **Statement of Comprehensive Income** (Income Statement) and the **Statement of Financial Position** (Balance Sheet), and use them to calculate and, more importantly, interpret key financial ratios. A high-level response will not only perform accurate calculations but will also critique the limitations of the data and integrate non-financial factors to build a convincing, holistic argument. This guide will equip you with the technical skills and analytical frameworks needed to excel.

## Key Financial Statements
### Statement of Comprehensive Income (Income Statement)
**What it is**: This statement presents a business's financial performance over a specific period (e.g., one year). It follows a clear structure to arrive at the final profit or loss.
**Why it matters**: It reveals the profitability of a business at different levels. Examiners expect you to understand the relationship between each stage. For instance, a high Gross Profit but a low Operating Profit suggests that the business is efficient at producing its goods but has high overheads (like marketing or rent), which is eroding the final profit.
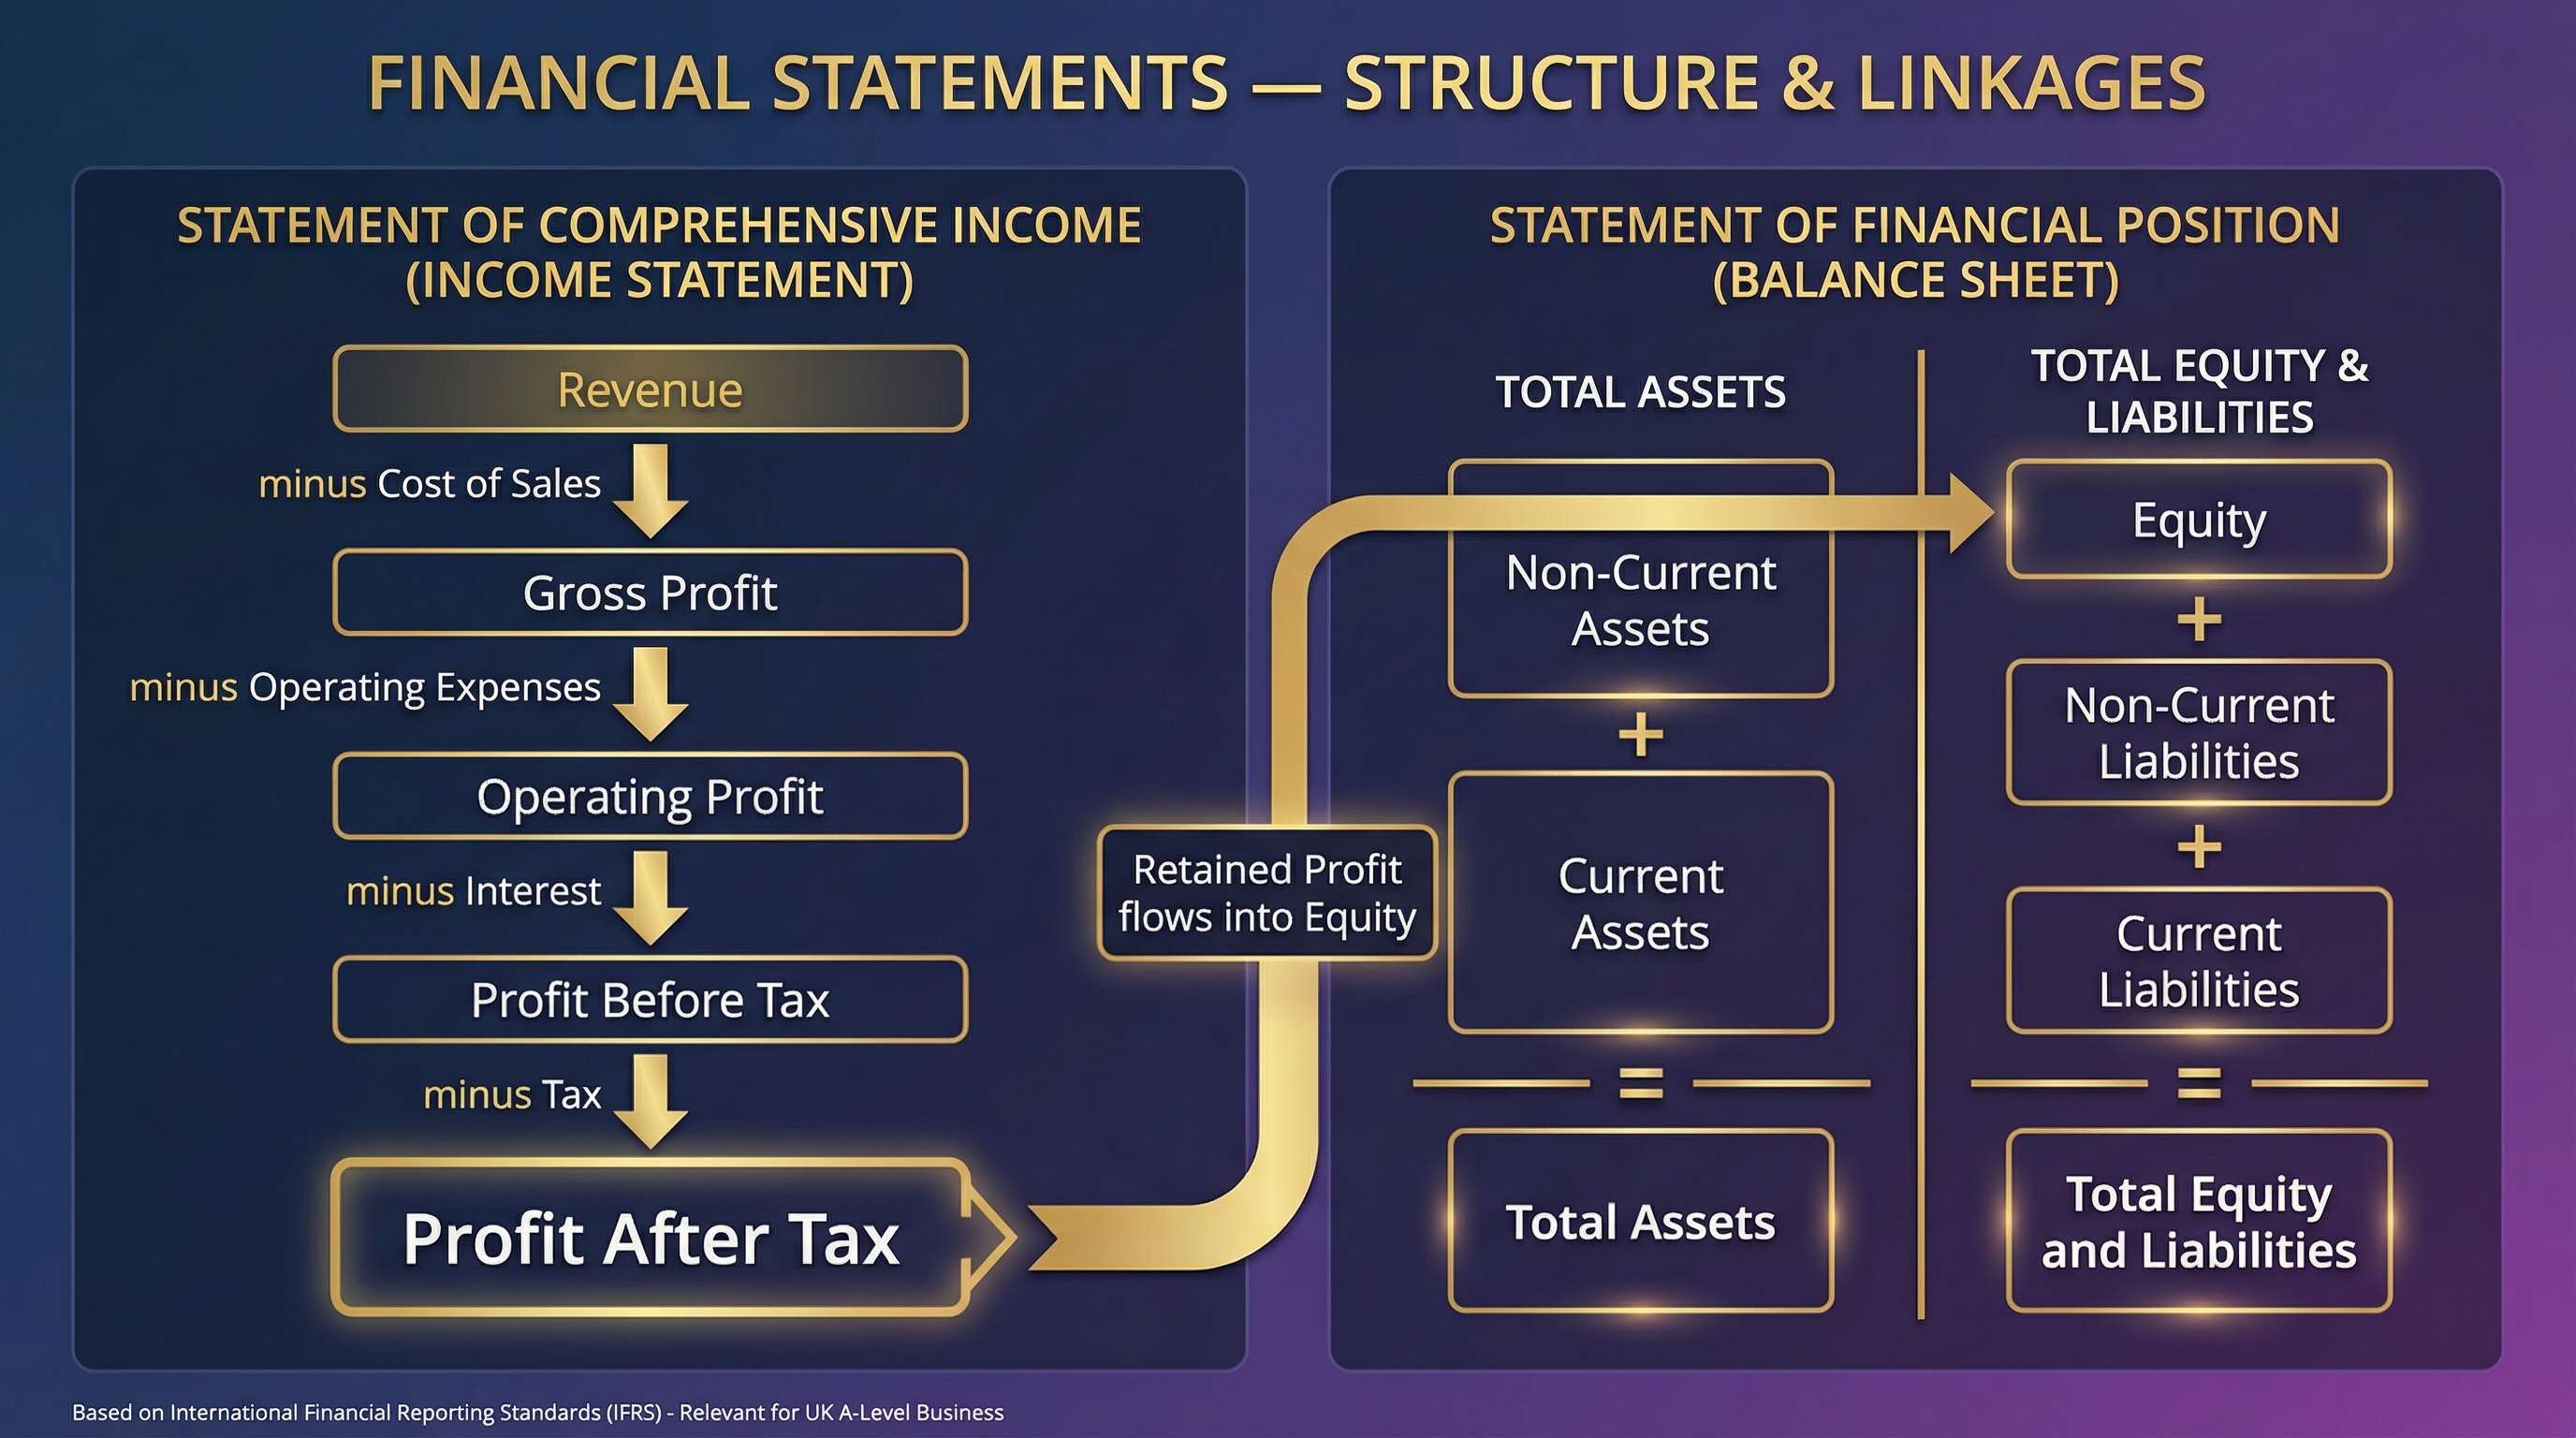
**Specific Knowledge**: You must know the exact structure:
1. **Revenue**: Total sales income.
2. **Cost of Sales**: Direct costs of production.
3. **Gross Profit**: Revenue - Cost of Sales.
4. **Operating Expenses**: All other running costs (salaries, rent, marketing).
5. **Operating Profit**: Gross Profit - Operating Expenses. (A key figure for ROCE).
6. **Interest**: Finance costs paid on debt.
7. **Profit Before Tax**: Operating Profit - Interest.
8. **Tax**: Corporation tax payable.
9. **Profit After Tax (Net Profit)**: The final profit remaining for shareholders.
### Statement of Financial Position (Balance Sheet)
**What it is**: This is a 'snapshot' of a business's financial position on a single day. It shows what the business owns (Assets) and what it owes (Liabilities), balanced by the funds invested by its owners (Equity).
**Why it matters**: It provides a clear picture of a company's structure, solvency, and liquidity. It is crucial for understanding how the business is financed (the mix of debt and equity) and whether it can meet its short-term obligations. The link between the two statements is vital: the **Retained Profit** from the Income Statement is added to the **Equity** on the Statement of Financial Position, forming a bridge between performance and position.
**Specific Knowledge**: You must know the components and the balancing formula: **Total Assets = Total Equity + Total Liabilities**.
* **Assets**:
* **Non-Current Assets**: Long-term assets not expected to be converted to cash within a year (e.g., property, machinery).
* **Current Assets**: Short-term assets that will be used or converted to cash within a year (e.g., inventory, trade receivables, cash).
* **Liabilities**:
* **Non-Current Liabilities**: Debts not due for repayment within a year (e.g., bank loans).
* **Current Liabilities**: Debts due for repayment within a year (e.g., trade payables, overdrafts).
* **Equity**: The capital invested by the owners/shareholders, including retained profit from previous years.
## Key Ratio Analysis
Ratio analysis is the main tool for interpreting financial statements. You must be able to calculate, comment on, and evaluate the significance of these ratios.
### Profitability Ratios
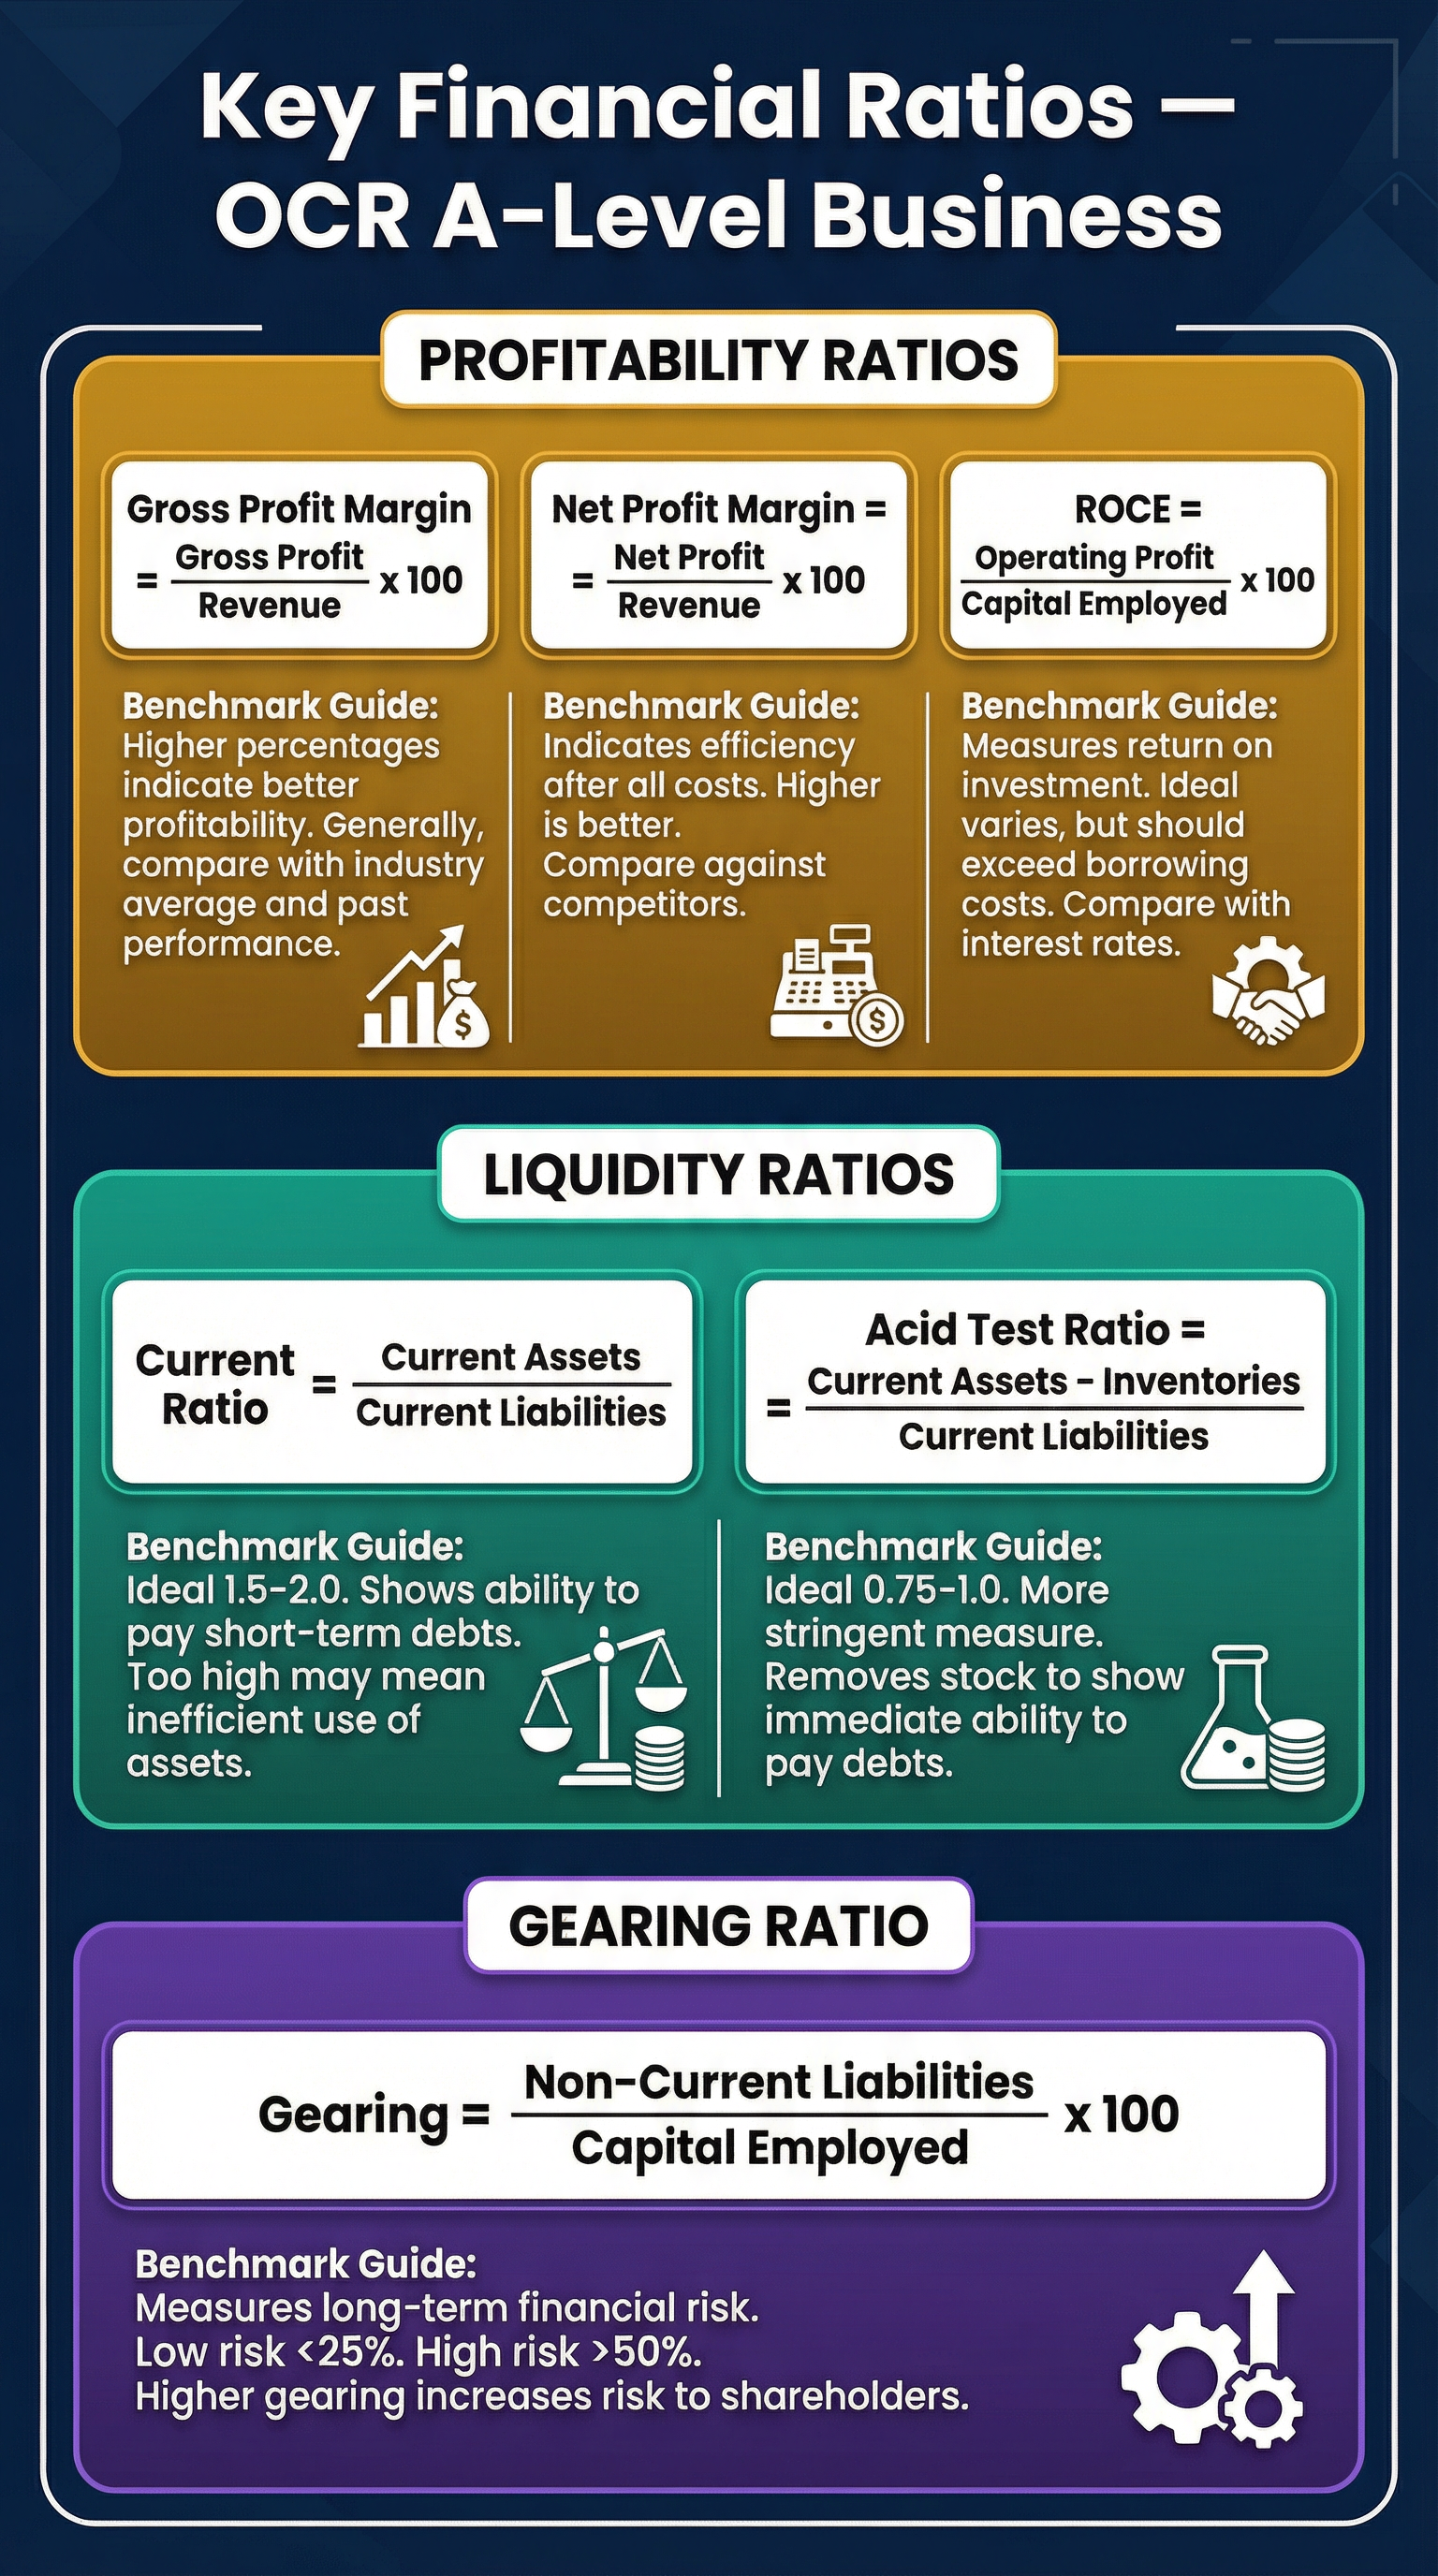
These measure the ability of a business to generate profit from its resources.
* **Return on Capital Employed (ROCE)**: The most important profitability ratio. It shows how much profit is generated for every £1 of long-term capital invested. A higher percentage is better. **Analysis is key**: compare it to previous years, competitors, and the bank's interest rate.
### Liquidity Ratios
These measure the ability of a business to pay its short-term debts.
* **Current Ratio**: A widely used measure of liquidity. An ideal range is often cited as 1.5-2.0. A ratio below 1 suggests the business may not have enough current assets to cover its current liabilities.
* **Acid Test Ratio (Quick Ratio)**: A more stringent test of liquidity as it excludes inventory (which can be hard to sell quickly). An ideal ratio is typically 1.0 or above.
### Gearing Ratio
This measures the proportion of a business's capital that comes from debt.
* **Gearing**: A ratio above 50% is considered high, indicating a greater reliance on borrowing and therefore higher risk. However, debt can be a powerful tool for growth if the returns generated (ROCE) are higher than the cost of the debt (interest)."