AQA · A-Level · Chemistry
Course version: 7405 · Version from Sept 2016
Calorimetry: Required practical 2 Measurement of an enthalpy change.
Required practical 2 measures an enthalpy change directly.
Checked against the AQA 7405 specification (opens in a new tab) on .
- Point 3 of 3
- 4 key terms
Study notes
From the checked teaching notes for this specification point.
The idea
Required practical 2 measures an enthalpy change directly. A known volume of solution goes into an insulated polystyrene cup with a lid. The starting temperature is recorded for a few minutes, the second reagent is added, and the temperature is followed until it falls steadily. Plotting temperature against time and extrapolating the cooling line back to the moment of mixing gives the temperature change with no heat loss, the ∆T for q = mc∆T. For example, adding zinc to copper sulfate solution. Design decisions are defensible: a lid and insulation cut heat exchange, stirring gives a uniform temperature, and an excess of one reagent guarantees the other reacts completely.
What earns the marks
- Recording temperature before, during and after mixing and plotting it against time.
- Extrapolating the cooling section back to the time of mixing to obtain a corrected ∆T.
- Identifying a design feature that reduces heat loss, such as a lid, insulation or a polystyrene cup.
- Using an excess of one reagent so the other is fully reacted, justified by which amount is used in the final division.
Common mistakes and how to put them right
Reading the highest temperature reached rather than the extrapolated value, which underestimates the enthalpy change.
Starting the timer at the moment of mixing so there is no pre-mixing line to extrapolate from.
Dividing by the moles of the reagent in excess rather than the limiting one.
Exam tips
- The absolute uncertainty for a temperature change (two readings) equals the thermometer's resolution (e.g., ±1 °C for 1 °C divisions), not double the resolution.
- To improve the experiment, change one variable and say what it does: more solid in the same volume of water increases ∆T and lowers the percentage uncertainty.
Try the lesson
The start of the Calorimetry: Required practical 2 Measurement of an enthalpy change. lesson, made from checked teaching notes for this specification point.
Have a go first
A student carries out a calorimetry experiment by dissolving 5.00 g of potassium chloride in 50.0 g of water. The temperature of the mixture falls by 4.20 K. Assume the specific heat capacity of the solution is 4.18\text{ J g}^{-1}\text{ K}^{-1} and the mass of the solution is the total mass of the water and the solid. Calculate the heat energy lost by the solution, in J, to three significant figures.
Listen
Required practical 2 measures an enthalpy change directly. A known volume of solution goes into an insulated polystyrene cup with a lid. The starting temperature is recorded for a few minutes, the second reagent is added, and the temperature is followed until it falls steadily. Plotting temperature against time and extrapolating the cooling line back to the moment of mixing gives the temperature change with no heat loss, the ∆T for q = mc∆T. For example, adding zinc to copper sulfate solution. Design decisions are defensible: a lid and insulation cut heat exchange, stirring gives a uniform temperature, and an excess of one reagent guarantees the other reacts completely. A strong answer earns marks for these points. recording temperature before, during and after mixing and plotting it against time. extrapolating the cooling section back to the time of mixing to obtain a corrected ∆T. identifying a design feature that reduces heat loss, such as a lid, insulation or a polystyrene cup. using an excess of one reagent so the other is fully reacted, justified by which amount is used in the final division. Exam tip: The absolute uncertainty for a temperature change (two readings) equals the thermometer's resolution (e.g., ±1 °C for 1 °C divisions), not double the resolution.
See it
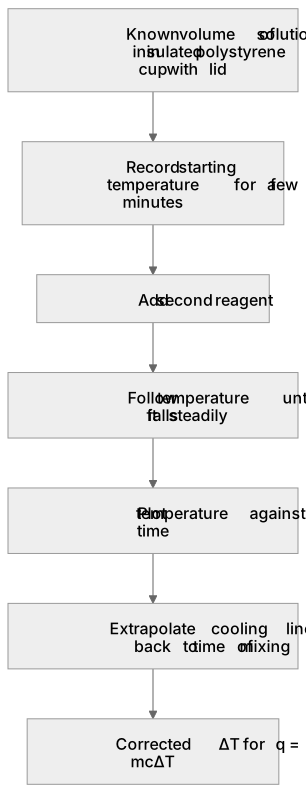
Put it in order
Put these steps in the order they happen.
- 1. Corrected ∆T for q = mc∆T
- 2. Extrapolate cooling line back to time of mixing
- 3. Add second reagent
- 4. Plot temperature against time
- 5. Known volume of solution in insulated polystyrene cup with lid
- 6. Record starting temperature for a few minutes
- 7. Follow temperature until it falls steadily
Key words
Say what each word means before you turn the card.
temperature against time graph
Try answering aloud or in your head before turning the card.
extrapolation to time of mixing
Try answering aloud or in your head before turning the card.
insulation and heat loss
Try answering aloud or in your head before turning the card.
percentage uncertainty
Try answering aloud or in your head before turning the card.
See every definition
- temperature against time graph
- A plot of recorded temperature before, during and after mixing, used to show how the temperature changes.
- extrapolation to time of mixing
- Extending the cooling section back to the time of mixing to obtain a corrected temperature change with no heat loss.
- insulation and heat loss
- A lid, insulation or a polystyrene cup is a design feature that cuts heat exchange and reduces heat loss.
- percentage uncertainty
- A value in the temperature change calculated from the resolution of the thermometer, which more solid in the same volume of water lowers.
Label the diagram
Some boxes have lost their names. Pick the right name for each number.
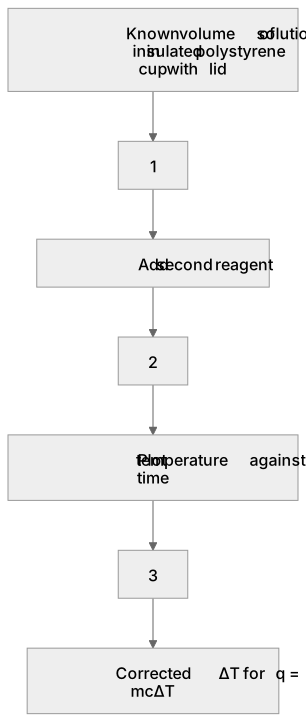
1Box 1
2Box 2
3Box 3
There is more to this lesson
The full lesson goes on to check your understanding and help you earn the marks. Create a free account to carry on, with your progress saved.
A week of Premium from your first lesson · Then the free plan continues · No card, no charge
Test your understanding of Calorimetry: Required practical 2 Measurement of an enthalpy change.
Active recall beats re-reading. Take an instant quiz now to test what you’ve learned and lock it into long-term memory.
A week of Premium from your first lesson · Then the free plan continues · No card, no charge