AQA · A-Level · Chemistry
Course version: 7405 · Version from Sept 2016
Students should be able to: use a Maxwell–Boltzmann distribution to help…
Full specification wording
Catalysts: Students should be able to: use a Maxwell–Boltzmann distribution to help explain how a catalyst increases the rate of a reaction involving a gas.
The catalyst question and the temperature question look alike but need opposite diagrams.
Checked against the AQA 7405 specification (opens in a new tab) on .
- Point 3 of 3
- 4 key terms
Study notes
From the checked teaching notes for this specification point.
The idea
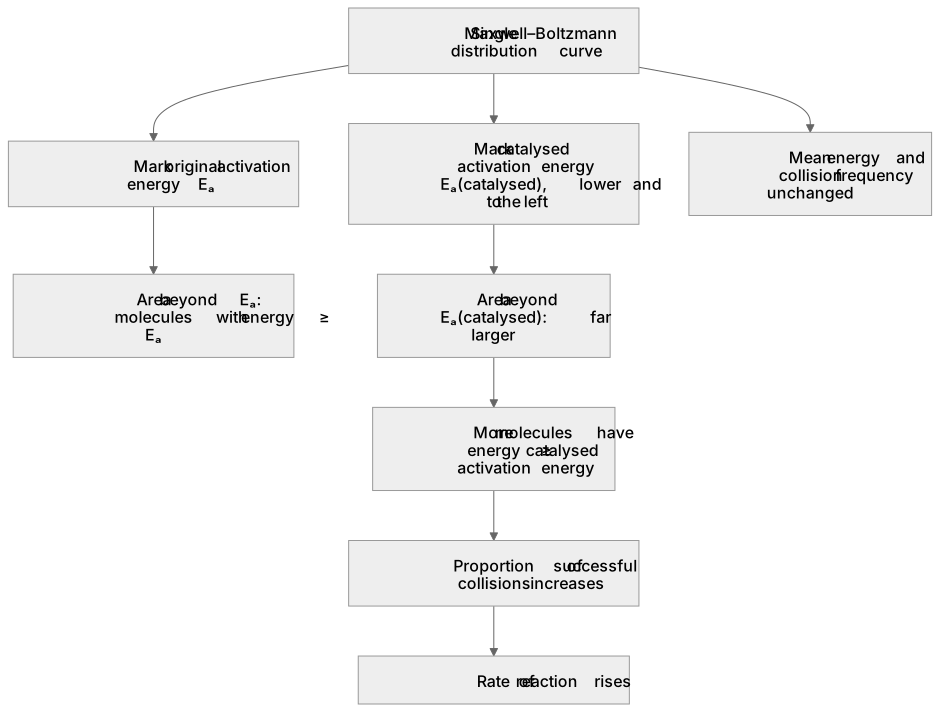
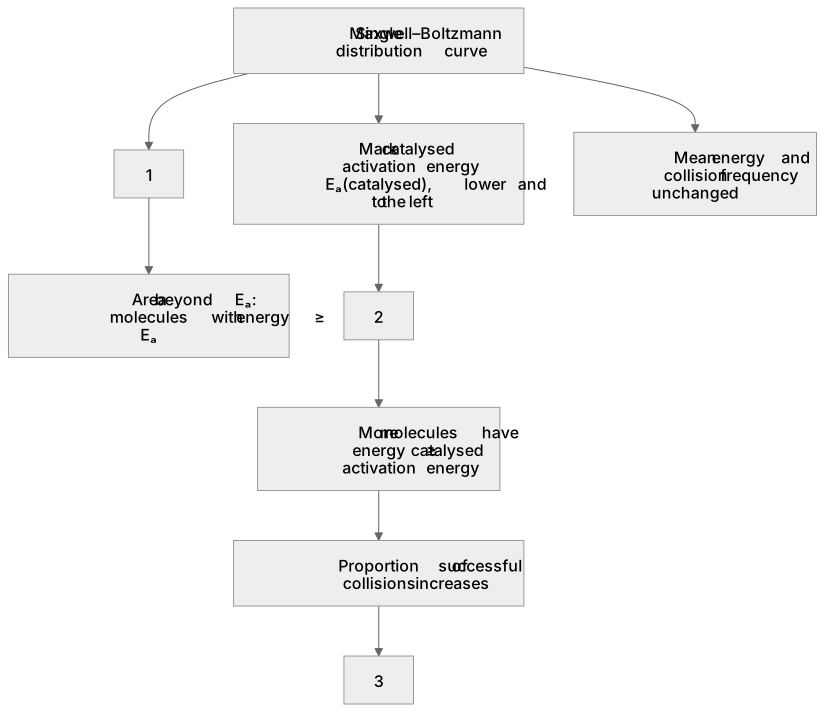
The catalyst question and the temperature question look alike but need opposite diagrams. Adding a catalyst does not change the temperature, so the distribution curve is not redrawn at all: a single curve is used and a second, lower activation energy is marked to the left of the original. The shaded area beyond that new barrier is far larger than the area beyond the original one, meaning many more molecules now have energy greater than or equal to the catalysed activation energy. The proportion of successful collisions rises and so does the rate, even though the mean energy of the molecules and the collision frequency are both unaltered. Marking two barriers on one unchanged curve is what the mark scheme is looking for.
What earns the marks
- A single correctly shaped distribution curve with both axes labelled.
- Two activation energies marked on the energy axis, the catalysed one lower.
- Stating that more molecules have energy greater than or equal to the catalysed activation energy.
- Concluding that the proportion, and hence the frequency, of successful collisions increases so the rate rises.
Common mistakes and how to put them right
Drawing a second curve for the catalysed reaction, as though the temperature had changed.
Shifting the distribution to the right instead of moving the activation energy to the left.
Saying the catalyst gives the molecules more energy.
Marking the catalysed Eₐ to the right of the original one.
Explaining the effect as an increase in collision frequency.
Exam tips
- Ask yourself first whether the temperature changed; if it did not, use one curve only.
- Label the two barriers Eₐ and Eₐ(catalysed) and shade both tails so the comparison is visible.
- Finish with a sentence naming the proportion of successful collisions, which is the explanation mark.
Try the lesson
The start of the Catalysts: Students should be able to: use a Maxwell–Boltzmann distribution to help explain how a catalyst increases the rate of a reaction involving a gas. lesson, made from checked teaching notes for this specification point.
Have a go first
How does a Maxwell-Boltzmann distribution show that a catalyst increases the rate of a gas-phase reaction?
Listen
The catalyst question and the temperature question look alike but need opposite diagrams. Adding a catalyst does not change the temperature, so the distribution curve is not redrawn at all: a single curve is used and a second, lower activation energy is marked to the left of the original. The shaded area beyond that new barrier is far larger than the area beyond the original one, meaning many more molecules now have energy greater than or equal to the catalysed activation energy. The proportion of successful collisions rises and so does the rate, even though the mean energy of the molecules and the collision frequency are both unaltered. Marking two barriers on one unchanged curve is what the mark scheme is looking for. A strong answer earns marks for these points. a single correctly shaped distribution curve with both axes labelled. two activation energies marked on the energy axis, the catalysed one lower. stating that more molecules have energy greater than or equal to the catalysed activation energy. concluding that the proportion, and hence the frequency, of successful collisions increases so the rate rises. Exam tip: Ask yourself first whether the temperature changed; if it did not, use one curve only.
See it
Key words
Say what each word means before you turn the card.
one curve, two barriers
Try answering aloud or in your head before turning the card.
lower catalysed activation energy
Try answering aloud or in your head before turning the card.
area beyond Eₐ
Try answering aloud or in your head before turning the card.
unchanged temperature
Try answering aloud or in your head before turning the card.
See every definition
- one curve, two barriers
- A single distribution curve is used and a second, lower activation energy is marked to the left of the original.
- lower catalysed activation energy
- The catalysed barrier is marked lower on the energy axis, to the left of the original activation energy.
- area beyond Eₐ
- The shaded area beyond the new barrier is far larger than the area beyond the original one.
- unchanged temperature
- Adding a catalyst does not change the temperature, so the distribution curve is not redrawn at all.
Label the diagram
Some boxes have lost their names. Pick the right name for each number.
1Box 1
2Box 2
3Box 3
There is more to this lesson
The full lesson goes on to check your understanding and help you earn the marks. Create a free account to carry on, with your progress saved.
A week of Premium from your first lesson · Then the free plan continues · No card, no charge
Test your understanding of Catalysts: Students should be able to: use a Maxwell–Boltzmann distribution to help explain how a catalyst increases the rate of a reaction involving a gas.
Active recall beats re-reading. Take an instant quiz now to test what you’ve learned and lock it into long-term memory.
A week of Premium from your first lesson · Then the free plan continues · No card, no charge