AQA · A-Level · Chemistry
Course version: 7405 · Version from Sept 2016
Students should be able to: use concentration–time graphs to deduce the…
Full specification wording
Determination of rate equation (A-level only): Students should be able to: use concentration–time graphs to deduce the rate of a reaction use initial concentration–time data to deduce the initial rate of a reaction use rate–concentration data or graphs to deduce the order (0, 1 or 2) with respect to a reactant derive the rate equation for a reaction from the orders with respect to each of the reactants use the orders with respect to reactants to provide information about the rate determining/limiting step of a reaction.
Two graph types do the work.
Checked against the AQA 7405 specification (opens in a new tab) on .
- Point 3 of 4
- 4 key terms
Study notes
From the checked teaching notes for this specification point.
The idea
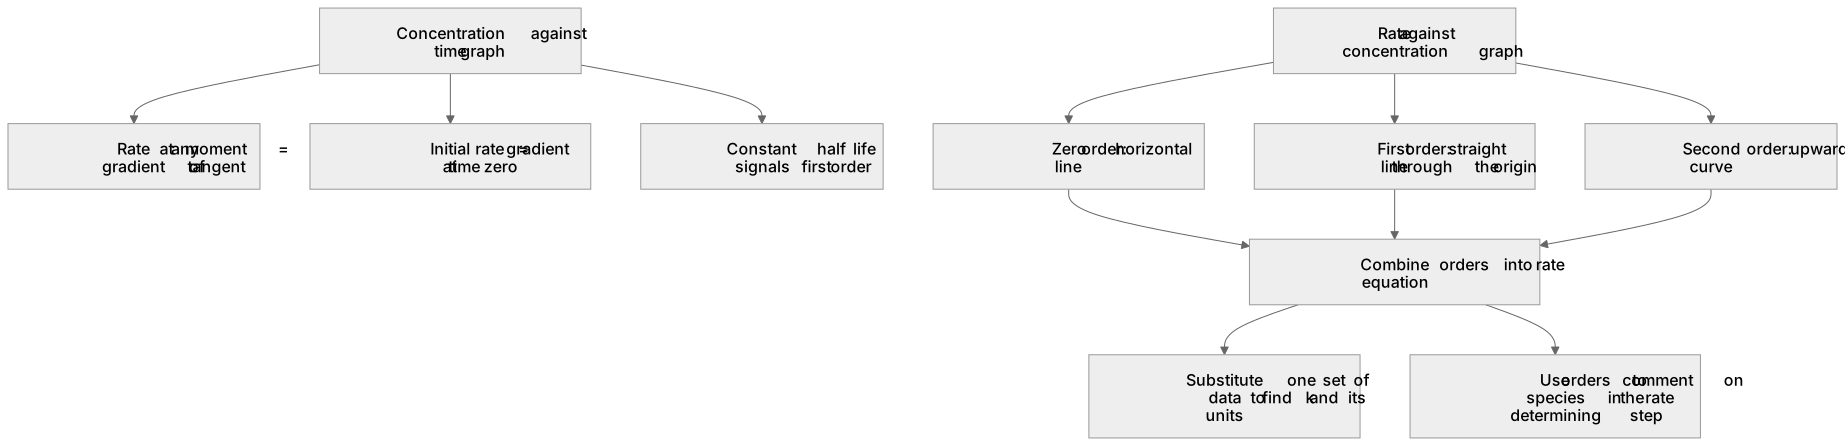
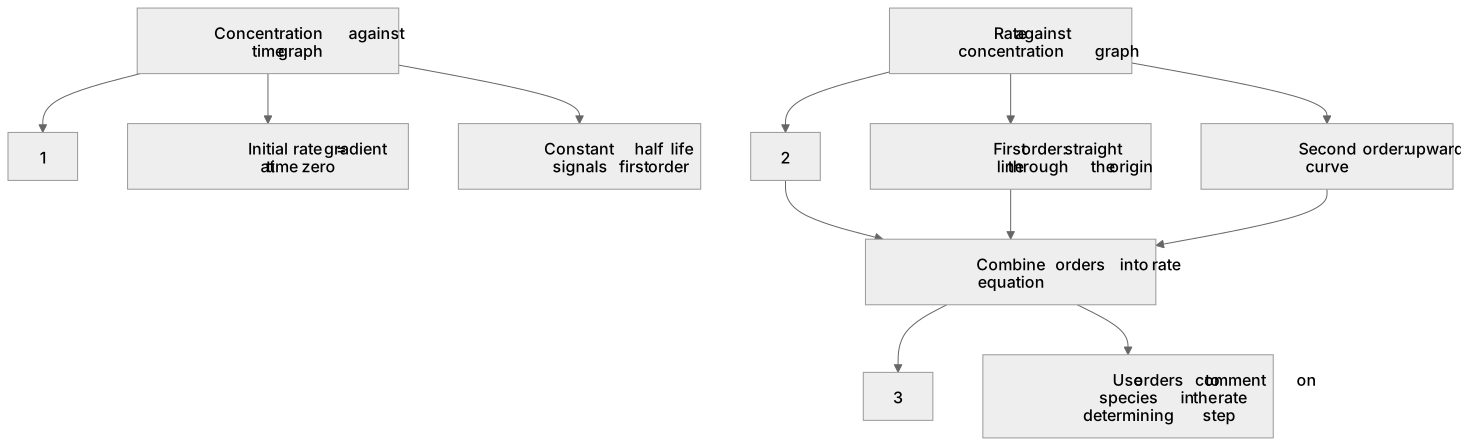
Two graph types do the work. On a concentration against time graph, the rate at any moment is the gradient of the tangent, and the initial rate is the gradient at time zero; a constant half life on such a curve signals first order. On a rate against concentration graph the shapes separate the orders directly: zero order gives a horizontal line, because rate does not change with concentration; first order gives a straight line through the origin, so doubling the concentration doubles the rate; second order gives an upward curve, with doubling the concentration quadrupling the rate. Combine the orders found for each reactant to write the rate equation, then substitute one set of data to find k and its units.
What earns the marks
- Determining a rate as the gradient of a tangent drawn to a concentration against time curve.
- Stating the order together with the graphical evidence, such as first order shown by a straight line through the origin.
- Combining the individual orders into the rate equation.
- The value of k with units, from substituting one consistent set of rate and concentration data.
- Using the orders to comment on the species present in the rate determining step.
Common mistakes and how to put them right
Stating an order without saying what the graph shows, which loses the explanation mark.
Describing a first order rate against concentration line as straight without adding that it passes through the origin.
Reading a rate from a concentration against time graph as a chord between two distant points rather than a tangent.
Mixing data from two different experiments when calculating k.
Confusing the shapes of the concentration against time and the rate against concentration graphs for the same order.
Exam tips
- Label which graph you are reading before you answer; the same order has different shapes on the two axes.
- Say straight line through the origin, or constant gradient through the origin, for first order.
- When a question says state how the graph shows this, the evidence sentence carries its own mark.
Try the lesson
The start of the Determination of rate equation (A-level only): Students should be able to: use concentration–time graphs to deduce the rate of a reaction use initial concentration–time data to deduce the initial rate of a reaction use rate–concentration data or graphs to deduce the order (0, 1 or 2) with respect to a reactant derive the rate equation for a reaction from the orders with respect to each of the reactants use the orders with respect to reactants to provide information about the rate determining/limiting step of a reaction. lesson, made from checked teaching notes for this specification point.
Have a go first
A concentration–time graph for a reactant is a straight line that falls from 0.80 mol dm⁻³ at 0 s to 0.20 mol dm⁻³ at 150 s. What is the rate of the reaction?
Listen
Two graph types do the work. On a concentration against time graph, the rate at any moment is the gradient of the tangent, and the initial rate is the gradient at time zero; a constant half life on such a curve signals first order. On a rate against concentration graph the shapes separate the orders directly: zero order gives a horizontal line, because rate does not change with concentration; first order gives a straight line through the origin, so doubling the concentration doubles the rate; second order gives an upward curve, with doubling the concentration quadrupling the rate. Combine the orders found for each reactant to write the rate equation, then substitute one set of data to find k and its units. A strong answer earns marks for these points. determining a rate as the gradient of a tangent drawn to a concentration against time curve. stating the order together with the graphical evidence, such as first order shown by a straight line through the origin. combining the individual orders into the rate equation. the value of k with units, from substituting one consistent set of rate and concentration data. Exam tip: Label which graph you are reading before you answer; the same order has different shapes on the two axes.
See it
Key words
Say what each word means before you turn the card.
tangents and initial rate
Try answering aloud or in your head before turning the card.
rate against concentration graphs
Try answering aloud or in your head before turning the card.
constant half life
Try answering aloud or in your head before turning the card.
deriving the rate equation
Try answering aloud or in your head before turning the card.
See every definition
- tangents and initial rate
- On a concentration against time graph, the rate at any moment is the gradient of the tangent, and the initial rate is the gradient at time zero.
- rate against concentration graphs
- The shapes separate the orders directly: zero order gives a horizontal line, first order gives a straight line through the origin, and second order gives an upward curve.
- constant half life
- A constant half life on a concentration against time curve signals first order.
- deriving the rate equation
- Combine the orders found for each reactant to write the rate equation, then substitute one set of data to find k and its units.
Label the diagram
Some boxes have lost their names. Pick the right name for each number.
1Box 1
2Box 2
3Box 3
There is more to this lesson
The full lesson goes on to check your understanding and help you earn the marks. Create a free account to carry on, with your progress saved.
A week of Premium from your first lesson · Then the free plan continues · No card, no charge
Test your understanding of Determination of rate equation (A-level only): Students should be able to: use concentration–time graphs to deduce the rate of a reaction use initial concentration–time data to deduce the initial rate of a reaction use rate–concentration data or graphs to deduce the order (0, 1 or 2) with respect to a reactant derive the rate equation for a reaction from the orders with respect to each of the reactants use the orders with respect to reactants to provide information about the rate determining/limiting step of a reaction.
Active recall beats re-reading. Take an instant quiz now to test what you’ve learned and lock it into long-term memory.
A week of Premium from your first lesson · Then the free plan continues · No card, no charge