AQA · GCSE · Chemistry
Course version: 8462 · Version from Sept 2018
Students should be able to: represent the distribution of results and make…
Full specification wording
Chemical measurements: Students should be able to: represent the distribution of results and make estimations of uncertainty use the range of a set of measurements about the mean as a measure of uncertainty.
When you repeat a measurement, the results form a distribution.
Checked against the AQA 8462 specification (opens in a new tab) on .
- Point 2 of 2
- 4 key terms
Study notes
From the checked teaching notes for this specification point.
The idea
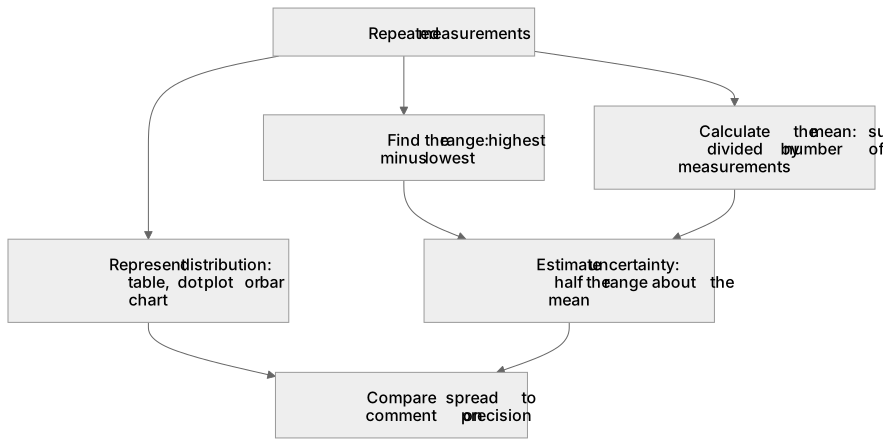
When you repeat a measurement, the results form a distribution. Plot them, for example as a dot plot or a small bar chart, to show how they cluster around the mean. The mean is the sum of the measurements divided by the number of measurements. The range is the difference between the highest and lowest values. A simple estimate of uncertainty is half the range, often written as ± half the range about the mean. For example, if four titres are 24.10 cm³, 24.20 cm³, 24.15 cm³ and 24.30 cm³, the mean is 24.19 cm³ and the range is 0.20 cm³, so the uncertainty is about ±0.10 cm³. A smaller range usually indicates more precise measurements.
What earns the marks
- Calculate the mean of a set of repeated measurements.
- Find the range by subtracting the lowest value from the highest value.
- Estimate uncertainty as half the range about the mean.
- Represent the distribution of results using a suitable table, dot plot or bar chart.
- Compare the spread of results to comment on the precision of the measurements.
Common mistakes and how to put them right
Dividing the range by the number of measurements instead of by two.
Put it right by using half the range as the uncertainty estimate.
Forgetting to include the correct unit with the mean, range or uncertainty.
Put it right by carrying the unit through every step.
Plotting the mean as a single value without showing the spread.
Put it right by representing all individual results in the distribution.
Exam tips
- Show the mean calculation clearly, including the sum and the number of measurements.
- Write the uncertainty as a value with the same unit as the measurements, for example ±0.10 cm³.
- Use a dot plot or bar chart to make the spread of results visible.
Try the lesson
The start of the Chemical measurements: Students should be able to: represent the distribution of results and make estimations of uncertainty use the range of a set of measurements about the mean as a measure of uncertainty. lesson, made from checked teaching notes for this specification point.
Have a go first
Four students each measure the time for a reaction to finish and record 20 s, 22 s, 21 s and 25 s. What is the range of these results?
Listen
When you repeat a measurement, the results form a distribution. Plot them, for example as a dot plot or a small bar chart, to show how they cluster around the mean. The mean is the sum of the measurements divided by the number of measurements. The range is the difference between the highest and lowest values. A simple estimate of uncertainty is half the range, often written as ± half the range about the mean. For example, if four titres are 24.10 cm³, 24.20 cm³, 24.15 cm³ and 24.30 cm³, the mean is 24.19 cm³ and the range is 0.20 cm³, so the uncertainty is about ±0.10 cm³. A smaller range usually indicates more precise measurements. A strong answer earns marks for these points. Calculate the mean of a set of repeated measurements. Find the range by subtracting the lowest value from the highest value. Estimate uncertainty as half the range about the mean. Represent the distribution of results using a suitable table, dot plot or bar chart. A common slip: Dividing the range by the number of measurements instead of by two. Instead, using half the range as the uncertainty estimate. Exam tip: Show the mean calculation clearly, including the sum and the number of measurements.
See it
Key words
Say what each word means before you turn the card.
Distribution of results
Try answering aloud or in your head before turning the card.
Mean and range
Try answering aloud or in your head before turning the card.
Estimating uncertainty
Try answering aloud or in your head before turning the card.
Precision of measurements
Try answering aloud or in your head before turning the card.
See every definition
- Distribution of results
- The pattern formed when repeated measurements are plotted, for example as a dot plot or a small bar chart, showing how they cluster around the mean.
- Mean and range
- The mean is the sum of the measurements divided by the number of measurements, and the range is the difference between the highest and lowest values.
- Estimating uncertainty
- A simple estimate given by half the range, often written as ± half the range about the mean.
- Precision of measurements
- A smaller range usually indicates more precise measurements, so the spread of results can be compared to comment on precision.
Label the diagram
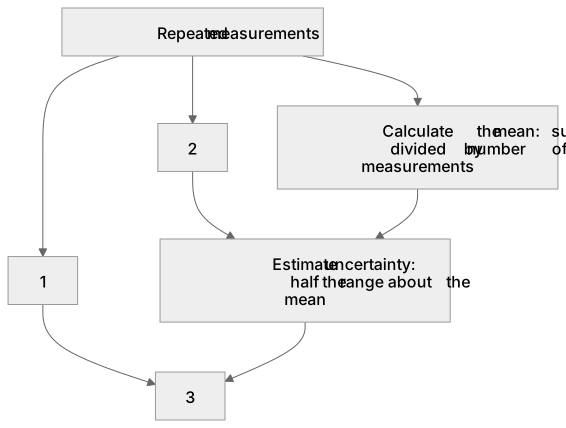
Some boxes have lost their names. Pick the right name for each number.
1Box 1
2Box 2
3Box 3
There is more to this lesson
The full lesson goes on to check your understanding and help you earn the marks. Create a free account to carry on, with your progress saved.
A week of Premium from your first lesson · Then the free plan continues · No card, no charge
Test your understanding of Chemical measurements: Students should be able to: represent the distribution of results and make estimations of uncertainty use the range of a set of measurements about the mean as a measure of uncertainty.
Active recall beats re-reading. Take an instant quiz now to test what you’ve learned and lock it into long-term memory.
A week of Premium from your first lesson · Then the free plan continues · No card, no charge