AQA · GCSE · Chemistry
Course version: 8462 · Version from Sept 2018
Required practical 5: investigate how changes in concentration affect the…
Full specification wording
Factors which affect the rates of chemical reactions: Required practical 5: investigate how changes in concentration affect the rates of reactions by a method involving measuring the volume of a gas produced and a method involving a change in colour or turbidity.
In this practical you change the concentration of a reactant and measure how fast the reaction proceeds.
Checked against the AQA 8462 specification (opens in a new tab) on .
- Point 3 of 4
- 4 key terms
Study notes
From the checked teaching notes for this specification point.
The idea
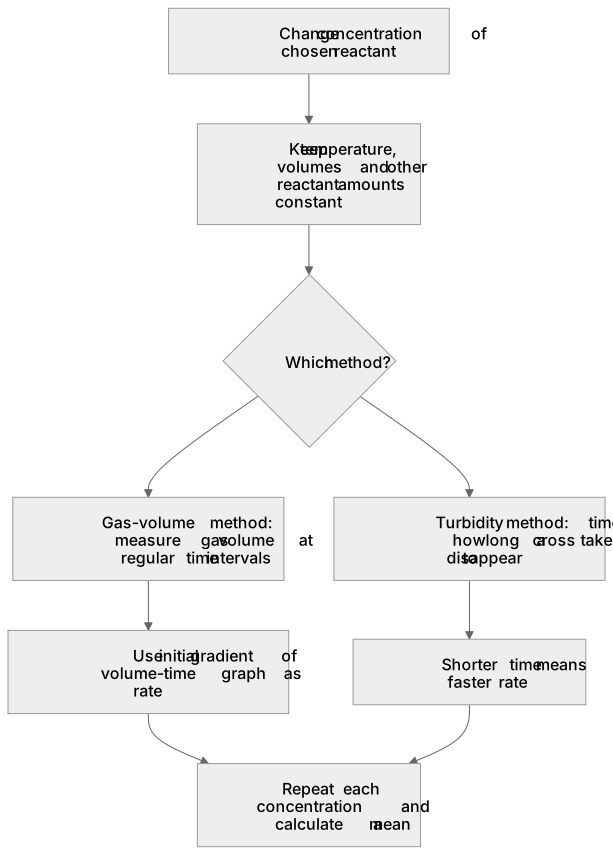
In this practical you change the concentration of a reactant and measure how fast the reaction proceeds. In the gas-volume method, a suitable reaction such as magnesium with dilute hydrochloric acid produces hydrogen; you collect the gas in a syringe or inverted measuring cylinder and record the volume at regular time intervals. The initial gradient of a volume-time graph gives a measure of rate. In the colour or turbidity method, a reaction such as sodium thiosulfate with dilute hydrochloric acid produces a pale yellow precipitate of sulfur; you time how long a black cross viewed through the mixture takes to disappear. A shorter time means a faster rate. In both methods, control variables such as temperature, volume and concentration of the other reactant must be kept constant for a fair comparison.
What earns the marks
- Change only the concentration of the chosen reactant while keeping temperature, volumes and other reactant amounts constant to make the comparison fair.
- In the gas-volume method, measure the volume of gas produced at regular time intervals using a gas syringe or inverted measuring cylinder, and use the initial rate from the graph.
- In the turbidity method, measure the time taken for a cross or mark to become obscured by the precipitate, recognising that a shorter time indicates a faster reaction.
- Plot appropriate graphs, such as volume of gas against time or time against concentration, and interpret the gradient or the time taken as a measure of rate.
- Repeat each concentration and calculate a mean to reduce the effect of random errors and improve the reliability of the conclusion.
- Identify and control relevant variables, including temperature, the volume of each solution and the mass or particle size of any solid reactant.
Common mistakes and how to put them right
Using the total volume of gas collected as the rate.
Put it right: The initial rate is found from the steepness of the graph at the start, not from the final volume.
Failing to keep the temperature constant when comparing concentrations.
Put it right: Use a water bath or record temperature and keep it the same, because temperature also changes rate.
Judging the endpoint of the turbidity method inconsistently.
Put it right: Use the same observer, the same cross and the same lighting, and to repeat readings to improve consistency.
Exam tips
- Describe the independent variable, dependent variable and at least two control variables when writing a method.
- Explain why a graph is plotted rather than relying on a single reading, linking the gradient to the rate of reaction.
- When comparing methods, state one advantage of measuring gas volume and one advantage of the turbidity method, such as continuous data versus a simple timed endpoint.
Try the lesson
The start of the Factors which affect the rates of chemical reactions: Required practical 5: investigate how changes in concentration affect the rates of reactions by a method involving measuring the volume of a gas produced and a method involving a change in colour or turbidity. lesson, made from checked teaching notes for this specification point.
Have a go first
In Required practical 5, marble chips react with dilute hydrochloric acid and the gas produced is collected in a syringe. Which gas is collected in the syringe?
Listen
In this practical you change the concentration of a reactant and measure how fast the reaction proceeds. In the gas-volume method, a suitable reaction such as magnesium with dilute hydrochloric acid produces hydrogen; you collect the gas in a syringe or inverted measuring cylinder and record the volume at regular time intervals. The initial gradient of a volume-time graph gives a measure of rate. In the colour or turbidity method, a reaction such as sodium thiosulfate with dilute hydrochloric acid produces a pale yellow precipitate of sulfur; you time how long a black cross viewed through the mixture takes to disappear. A shorter time means a faster rate. In both methods, control variables such as temperature, volume and concentration of the other reactant must be kept constant for a fair comparison. A strong answer earns marks for these points. Change only the concentration of the chosen reactant while keeping temperature, volumes and other reactant amounts constant to make the comparison fair. In the gas-volume method, measure the volume of gas produced at regular time intervals using a gas syringe or inverted measuring cylinder, and use the initial rate from the graph. In the turbidity method, measure the time taken for a cross or mark to become obscured by the precipitate, recognising that a shorter time indicates a faster reaction. Plot appropriate graphs, such as volume of gas against time or time against concentration, and interpret the gradient or the time taken as a measure of rate. A common slip: Using the total volume of gas collected as the rate. Instead, the initial rate is found from the steepness of the graph at the start, not from the final volume. Exam tip: Describe the independent variable, dependent variable and at least two control variables when writing a method.
See it
Key words
Say what each word means before you turn the card.
Rate measurement
Try answering aloud or in your head before turning the card.
Fair testing
Try answering aloud or in your head before turning the card.
Graph interpretation
Try answering aloud or in your head before turning the card.
Error and uncertainty
Try answering aloud or in your head before turning the card.
See every definition
- Rate measurement
- In the gas-volume method, the initial gradient of a volume-time graph gives a measure of rate, while in the turbidity method a shorter time means a faster rate.
- Fair testing
- Only the concentration of the chosen reactant is changed while temperature, volumes and other reactant amounts are kept constant for a fair comparison.
- Graph interpretation
- Plotting a graph such as volume of gas against time allows the gradient or the time taken to be interpreted as a measure of rate.
- Error and uncertainty
- Repeating each concentration and calculating a mean reduces the effect of random errors and improves the reliability of the conclusion.
Label the diagram
Some boxes have lost their names. Pick the right name for each number.
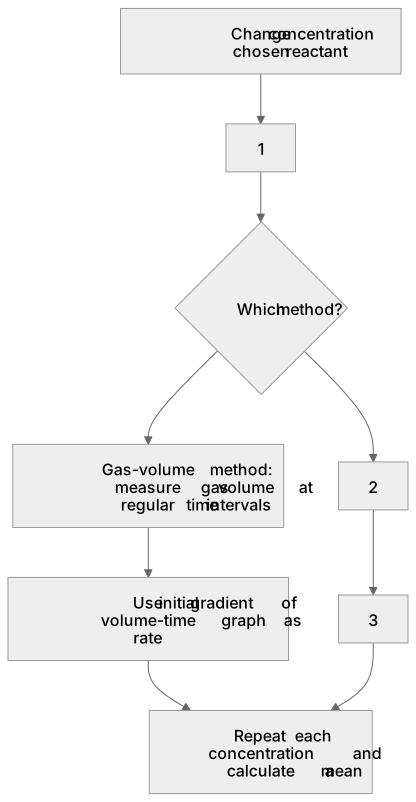
1Box 1
2Box 2
3Box 3
There is more to this lesson
The full lesson goes on to check your understanding and help you earn the marks. Create a free account to carry on, with your progress saved.
A week of Premium from your first lesson · Then the free plan continues · No card, no charge
Test your understanding of Factors which affect the rates of chemical reactions: Required practical 5: investigate how changes in concentration affect the rates of reactions by a method involving measuring the volume of a gas produced and a method involving a change in colour or turbidity.
Active recall beats re-reading. Take an instant quiz now to test what you’ve learned and lock it into long-term memory.
A week of Premium from your first lesson · Then the free plan continues · No card, no charge