AQA · GCSE · Chemistry
Course version: 8462 · Version from Sept 2018
Students should be able to interpret an instrumental result given…
Full specification wording
Flame emission spectroscopy: Students should be able to interpret an instrumental result given appropriate data in chart or tabular form, when accompanied by a reference set in the same form, limited to flame emission spectroscopy.
Flame emission spectroscopy identifies metal ions by the light they emit when heated.
Checked against the AQA 8462 specification (opens in a new tab) on .
- Point 4 of 4
- 4 key terms
Study notes
From the checked teaching notes for this specification point.
The idea
Flame emission spectroscopy identifies metal ions by the light they emit when heated. A sample is vaporised in a flame; excited electrons fall back to lower energy levels and emit light of characteristic wavelengths. The instrument separates this light into a line spectrum, and the pattern of lines identifies the metal. To interpret a result, compare the sample's chart or table with a reference set presented in the same form: match line positions or wavelengths, not brightness alone. For example, a sample showing a line at the same wavelength as a reference line for sodium indicates sodium ions. In tabular form, match the recorded wavelength values; in chart form, match peak positions. The reference set must be in the same form so the comparison is valid.
What earns the marks
- State that each metal ion emits light with a characteristic set of wavelengths when heated in a flame.
- Describe how to compare the sample result with the reference set by matching line positions or wavelength values.
- Identify the metal ion present when the sample's lines match those of a reference in the same form.
- Explain that the reference set must be in the same form (chart or table) so that the comparison is valid.
- Use the term line spectrum or emission spectrum correctly when describing the instrumental output.
- Recognise that brightness or intensity alone does not identify the metal; the pattern of wavelengths does.
Common mistakes and how to put them right
Matching only the brightest line and ignoring the full pattern.
Put it right: Compare all line positions or wavelengths with the reference set.
Comparing a chart result with a tabular reference.
Put it right: Use a reference set in the same form as the sample result.
Confusing flame emission spectroscopy with flame tests by colour alone.
Put it right: Use the instrument's line spectrum and wavelength values for identification.
Exam tips
- Read the axes and units on any chart before comparing peaks; wavelength is usually in nanometres.
- When a table is given, quote the matching wavelength value and name the metal ion it identifies.
- If two reference sets are similar, check every line rather than a single peak before deciding.
Try the lesson
The start of the Flame emission spectroscopy: Students should be able to interpret an instrumental result given appropriate data in chart or tabular form, when accompanied by a reference set in the same form, limited to flame emission spectroscopy. lesson, made from checked teaching notes for this specification point.
Have a go first
A flame emission spectrum of an unknown sample shows a single bright line at 590 nm. A reference spectrum of sodium shows a bright line at 590 nm. What does this result show about the sample?
Listen
Flame emission spectroscopy identifies metal ions by the light they emit when heated. A sample is vaporised in a flame; excited electrons fall back to lower energy levels and emit light of characteristic wavelengths. The instrument separates this light into a line spectrum, and the pattern of lines identifies the metal. To interpret a result, compare the sample's chart or table with a reference set presented in the same form: match line positions or wavelengths, not brightness alone. For example, a sample showing a line at the same wavelength as a reference line for sodium indicates sodium ions. In tabular form, match the recorded wavelength values; in chart form, match peak positions. The reference set must be in the same form so the comparison is valid. A strong answer earns marks for these points. State that each metal ion emits light with a characteristic set of wavelengths when heated in a flame. Describe how to compare the sample result with the reference set by matching line positions or wavelength values. Identify the metal ion present when the sample's lines match those of a reference in the same form. Explain that the reference set must be in the same form (chart or table) so that the comparison is valid. A common slip: Matching only the brightest line and ignoring the full pattern. Instead, compare all line positions or wavelengths with the reference set. Exam tip: Read the axes and units on any chart before comparing peaks; wavelength is usually in nanometres.
See it
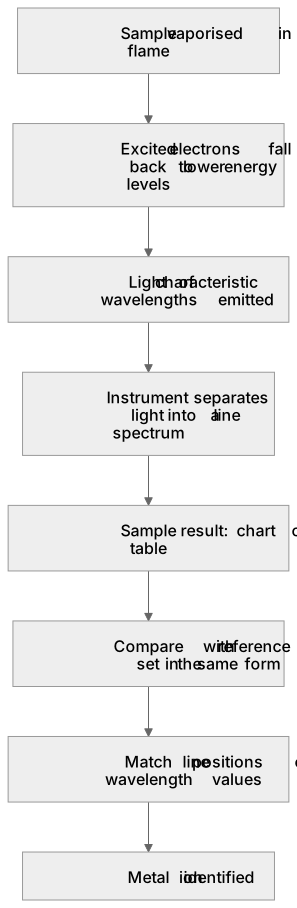
Put it in order
Put these steps in the order they happen.
- 1. Sample result: chart or table
- 2. Metal ion identified
- 3. Compare with reference set in the same form
- 4. Sample vaporised in a flame
- 5. Excited electrons fall back to lower energy levels
- 6. Match line positions or wavelength values
- 7. Light of characteristic wavelengths emitted
- 8. Instrument separates light into a line spectrum
Key words
Say what each word means before you turn the card.
Instrumental analysis
Try answering aloud or in your head before turning the card.
Atomic emission
Try answering aloud or in your head before turning the card.
Characteristic line spectra
Try answering aloud or in your head before turning the card.
Identification by comparison with reference data
Try answering aloud or in your head before turning the card.
See every definition
- Instrumental analysis
- A method in which an instrument is used to produce a result, here limited to flame emission spectroscopy, that is interpreted using appropriate data in chart or tabular form.
- Atomic emission
- When a sample is vaporised in a flame, excited electrons fall back to lower energy levels and emit light of characteristic wavelengths.
- Characteristic line spectra
- The instrument separates the emitted light into a line spectrum, and the pattern of lines identifies the metal.
- Identification by comparison with reference data
- The sample's chart or table is compared with a reference set in the same form, matching line positions or wavelengths rather than brightness alone.
Label the diagram
Some boxes have lost their names. Pick the right name for each number.
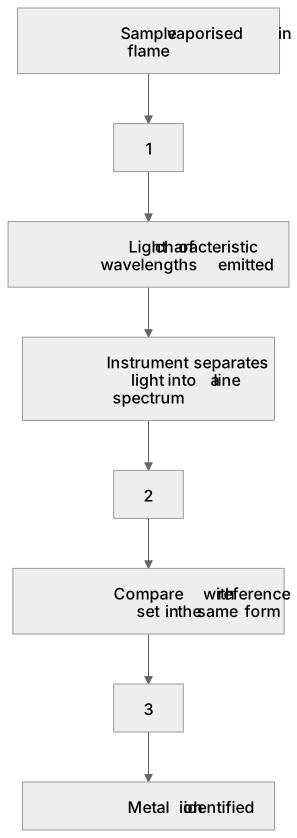
1Box 1
2Box 2
3Box 3
There is more to this lesson
The full lesson goes on to check your understanding and help you earn the marks. Create a free account to carry on, with your progress saved.
A week of Premium from your first lesson · Then the free plan continues · No card, no charge
Test your understanding of Flame emission spectroscopy: Students should be able to interpret an instrumental result given appropriate data in chart or tabular form, when accompanied by a reference set in the same form, limited to flame emission spectroscopy.
Active recall beats re-reading. Take an instant quiz now to test what you’ve learned and lock it into long-term memory.
A week of Premium from your first lesson · Then the free plan continues · No card, no charge