AQA · GCSE · Chemistry
Course version: 8462 · Version from Sept 2018
The output is a line spectrum that can be analysed to identify the metal…
Full specification wording
Flame emission spectroscopy: The output is a line spectrum that can be analysed to identify the metal ions in the solution and measure their concentrations.
The output of flame emission spectroscopy is a line spectrum.
Checked against the AQA 8462 specification (opens in a new tab) on .
- Point 3 of 4
- 4 key terms
Study notes
From the checked teaching notes for this specification point.
The idea
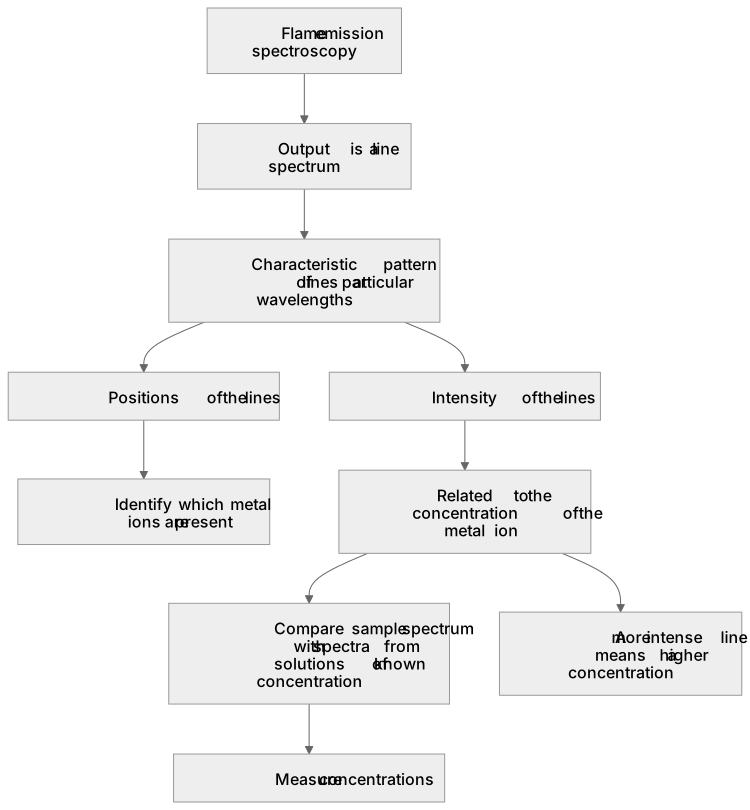
The output of flame emission spectroscopy is a line spectrum. Each metal ion produces a characteristic pattern of lines at particular wavelengths, so the positions of the lines can be used to identify which metal ions are present in the solution. The intensity, or brightness, of the lines relates to how much of each metal ion is present, so the spectrum can also be used to measure concentrations. This is often done by comparing the sample spectrum with spectra from solutions of known concentration, sometimes called calibration solutions. A more intense line means a higher concentration of that metal ion.
What earns the marks
- The output of flame emission spectroscopy is a line spectrum.
- Each metal ion produces a characteristic pattern of lines at particular wavelengths.
- The positions of the lines are used to identify which metal ions are present in the solution.
- The intensity of the lines is related to the concentration of the metal ion.
- Concentrations can be measured by comparing the sample spectrum with spectra from solutions of known concentration.
- A more intense line indicates a higher concentration of that metal ion.
Common mistakes and how to put them right
Saying the line spectrum shows a continuous rainbow.
Put it right: A line spectrum has separate bright lines at specific wavelengths.
Saying the number of lines directly gives the concentration.
Put it right: Line positions identify the metal ion and line intensity relates to concentration.
Saying the spectrum identifies non-metal ions.
Put it right: Flame emission spectroscopy analyses metal ions.
Exam tips
- Distinguish clearly between line positions for identification and line intensity for concentration.
- Mention comparison with known concentrations when explaining how concentration is measured.
- Use the phrase characteristic pattern of lines to show why identification is possible.
Try the lesson
The start of the Flame emission spectroscopy: The output is a line spectrum that can be analysed to identify the metal ions in the solution and measure their concentrations. lesson, made from checked teaching notes for this specification point.
Have a go first
What is the output of flame emission spectroscopy that can be analysed to identify metal ions?
Listen
The output of flame emission spectroscopy is a line spectrum. Each metal ion produces a characteristic pattern of lines at particular wavelengths, so the positions of the lines can be used to identify which metal ions are present in the solution. The intensity, or brightness, of the lines relates to how much of each metal ion is present, so the spectrum can also be used to measure concentrations. This is often done by comparing the sample spectrum with spectra from solutions of known concentration, sometimes called calibration solutions. A more intense line means a higher concentration of that metal ion. A strong answer earns marks for these points. The output of flame emission spectroscopy is a line spectrum. Each metal ion produces a characteristic pattern of lines at particular wavelengths. The positions of the lines are used to identify which metal ions are present in the solution. The intensity of the lines is related to the concentration of the metal ion. A common slip: Saying the line spectrum shows a continuous rainbow: the error is confusing a line spectrum with a continuous spectrum. Instead, a line spectrum has separate bright lines at specific wavelengths. Exam tip: Distinguish clearly between line positions for identification and line intensity for concentration.
See it
Key words
Say what each word means before you turn the card.
Line spectra
Try answering aloud or in your head before turning the card.
Identification of metal ions
Try answering aloud or in your head before turning the card.
Measurement of concentration
Try answering aloud or in your head before turning the card.
Calibration
Try answering aloud or in your head before turning the card.
See every definition
- Line spectra
- The output of flame emission spectroscopy, in which each metal ion produces a characteristic pattern of lines at particular wavelengths.
- Identification of metal ions
- Using the positions of the lines in the spectrum to identify which metal ions are present in the solution.
- Measurement of concentration
- Using the intensity of the lines, often by comparing the sample spectrum with spectra from solutions of known concentration.
- Calibration
- Comparing the sample spectrum with spectra from solutions of known concentration.
Label the diagram
Some boxes have lost their names. Pick the right name for each number.
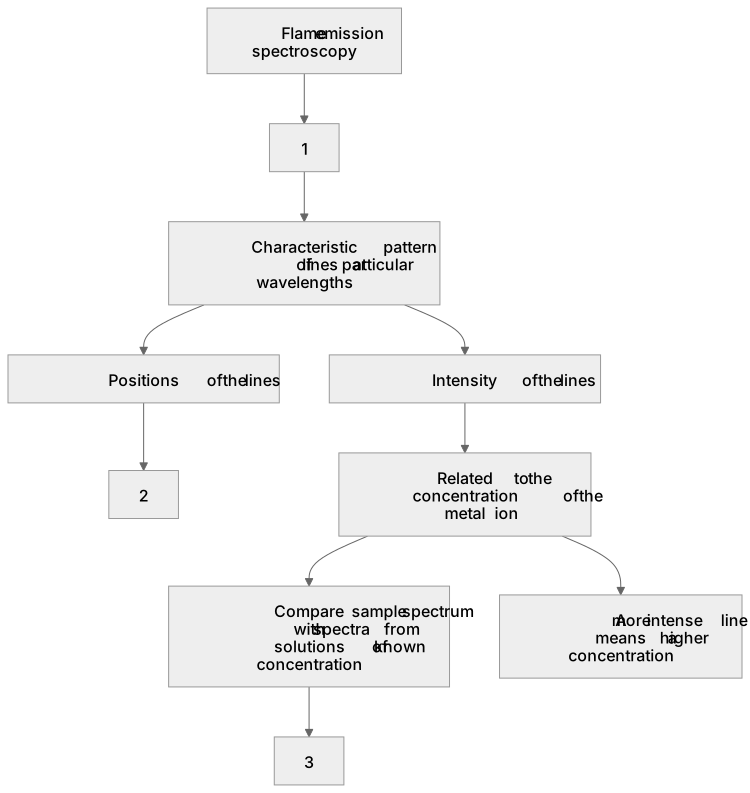
1Box 1
2Box 2
3Box 3
There is more to this lesson
The full lesson goes on to check your understanding and help you earn the marks. Create a free account to carry on, with your progress saved.
A week of Premium from your first lesson · Then the free plan continues · No card, no charge
Test your understanding of Flame emission spectroscopy: The output is a line spectrum that can be analysed to identify the metal ions in the solution and measure their concentrations.
Active recall beats re-reading. Take an instant quiz now to test what you’ve learned and lock it into long-term memory.
A week of Premium from your first lesson · Then the free plan continues · No card, no charge