AQA · GCSE · Chemistry
Course version: 8462 · Version from Sept 2018
Reaction profiles can be used to show the relative energies of reactants…
Full specification wording
Reaction profiles: Reaction profiles can be used to show the relative energies of reactants and products, the activation energy and the overall energy change of a reaction.
A reaction profile, also called an energy level diagram, is a graph of energy against the progress of a reaction.
Checked against the AQA 8462 specification (opens in a new tab) on .
- Point 3 of 4
- 4 key terms
Study notes
From the checked teaching notes for this specification point.
The idea
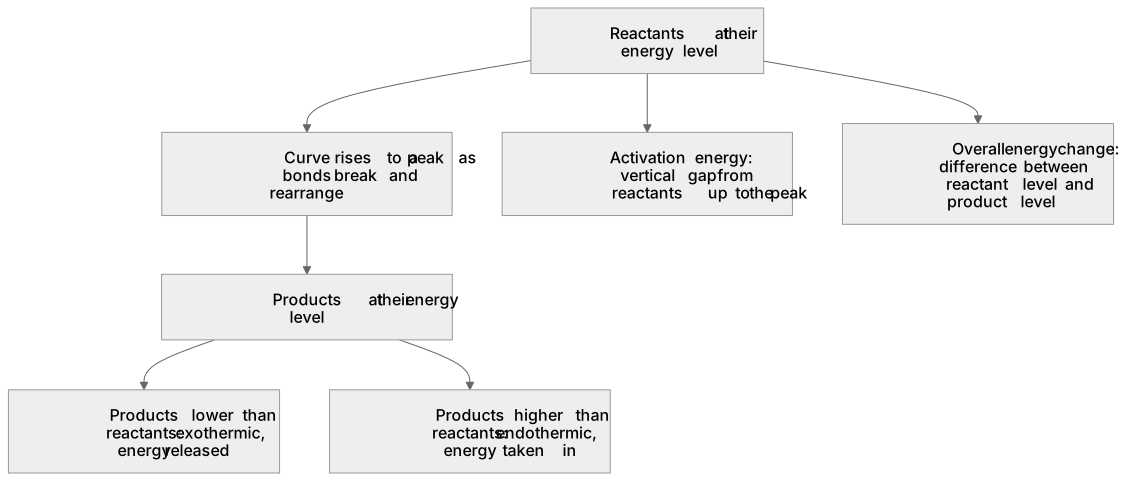
A reaction profile, also called an energy level diagram, is a graph of energy against the progress of a reaction. The reactants start at one energy level and the products finish at another, joined by a curved line that rises to a peak as bonds break and rearrange. Three features carry the chemistry. The relative heights of the start and finish levels show whether the products are lower or higher in energy than the reactants. The vertical gap from the reactants up to the peak is the activation energy. The difference between the reactant and product levels is the overall energy change. If products sit lower, energy is released to the surroundings and the reaction is exothermic; if products sit higher, energy is taken in and the reaction is endothermic.
What earns the marks
- A reaction profile plots energy on the vertical axis against reaction progress on the horizontal axis.
- The reactant and product levels show relative energy: products lower than reactants indicates an exothermic change, products higher indicates an endothermic change.
- The activation energy is the vertical distance from the reactant energy level to the peak of the curve.
- The overall energy change is the vertical difference between the reactant level and the product level.
- The curved line represents how energy varies as bonds break and new bonds form during the reaction.
- Profiles allow comparison of different reactions, including the effect of a catalyst, which lowers the peak.
Common mistakes and how to put them right
Measuring the overall energy change from the peak to the products instead of from the reactants to the products.
Drawing the activation energy arrow starting at the products when the reaction is endothermic.
Put it right: It must always start at the reactants.
Treating the peak as a stable intermediate that can be isolated, when it represents the highest-energy arrangement along the pathway.
Exam tips
- Label both axes and mark the reactant level, product level, peak, activation energy and overall energy change clearly.
- Use dashed horizontal lines from the reactant and product levels to the energy axis to make comparisons easier to read.
- State whether the reaction is exothermic or endothermic and justify it by referring to the relative heights of the two levels.
Try the lesson
The start of the Reaction profiles: Reaction profiles can be used to show the relative energies of reactants and products, the activation energy and the overall energy change of a reaction. lesson, made from checked teaching notes for this specification point.
Have a go first
On a reaction profile, what does the vertical distance between the reactants line and the peak of the curve represent?
Listen
A reaction profile, also called an energy level diagram, is a graph of energy against the progress of a reaction. The reactants start at one energy level and the products finish at another, joined by a curved line that rises to a peak as bonds break and rearrange. Three features carry the chemistry. The relative heights of the start and finish levels show whether the products are lower or higher in energy than the reactants. The vertical gap from the reactants up to the peak is the activation energy. The difference between the reactant and product levels is the overall energy change. If products sit lower, energy is released to the surroundings and the reaction is exothermic; if products sit higher, energy is taken in and the reaction is endothermic. A strong answer earns marks for these points. A reaction profile plots energy on the vertical axis against reaction progress on the horizontal axis. The reactant and product levels show relative energy: products lower than reactants indicates an exothermic change, products higher indicates an endothermic change. The activation energy is the vertical distance from the reactant energy level to the peak of the curve. The overall energy change is the vertical difference between the reactant level and the product level. Exam tip: Label both axes and mark the reactant level, product level, peak, activation energy and overall energy change clearly.
See it
Key words
Say what each word means before you turn the card.
Reaction profile
Try answering aloud or in your head before turning the card.
Activation energy
Try answering aloud or in your head before turning the card.
Overall energy change
Try answering aloud or in your head before turning the card.
Exothermic
Try answering aloud or in your head before turning the card.
See every definition
- Reaction profile
- A graph of energy against the progress of a reaction, also called an energy level diagram.
- Activation energy
- The vertical gap from the reactants up to the peak of the curve.
- Overall energy change
- The difference between the reactant and product levels.
- Exothermic
- A reaction in which products sit lower, so energy is released to the surroundings.
Label the diagram
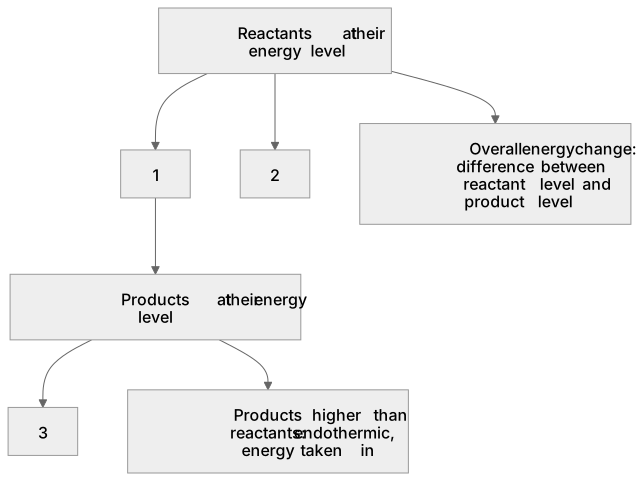
Some boxes have lost their names. Pick the right name for each number.
1Box 1
2Box 2
3Box 3
There is more to this lesson
The full lesson goes on to check your understanding and help you earn the marks. Create a free account to carry on, with your progress saved.
A week of Premium from your first lesson · Then the free plan continues · No card, no charge
Test your understanding of Reaction profiles: Reaction profiles can be used to show the relative energies of reactants and products, the activation energy and the overall energy change of a reaction.
Active recall beats re-reading. Take an instant quiz now to test what you’ve learned and lock it into long-term memory.
A week of Premium from your first lesson · Then the free plan continues · No card, no charge