AQA · GCSE · Chemistry
Course version: 8462 · Version from Sept 2018
Students should be able to: extract and interpret information about…
Full specification wording
Using the Earth's resources and sustainable development: Students should be able to: extract and interpret information about resources from charts, graphs and tables use orders of magnitude to evaluate the significance of data.
Resource data are often presented in charts, graphs and tables showing reserves, production rates or consumption over time.
Checked against the AQA 8462 specification (opens in a new tab) on .
- Point 6 of 6
- 4 key terms
Study notes
From the checked teaching notes for this specification point.
The idea
Resource data are often presented in charts, graphs and tables showing reserves, production rates or consumption over time. To extract information, read the axes, units and key carefully, then locate the required value. To interpret, describe the trend and use the data to compare resources. Orders of magnitude express how many powers of ten separate two values. For example, 10³ is one order of magnitude larger than 10², and 10⁶ is four orders of magnitude larger than 10². Comparing orders of magnitude shows whether a difference is significant: a resource lasting 10⁶ years is far more abundant than one lasting 10² years, whereas 10² and 3 × 10² differ by less than one order of magnitude. This helps judge which resource is genuinely more plentiful or which change is meaningful.
What earns the marks
- Read the title, axes, units and key before extracting values from a chart, graph or table.
- Interpret a trend by describing whether values increase, decrease or remain constant and by quoting data points.
- An order of magnitude is a factor of 10, so 10³ is one order of magnitude greater than 10².
- Compare values by finding the ratio or the difference in powers of ten to judge significance.
- Use orders of magnitude to decide whether a difference in resource data is large enough to matter.
Common mistakes and how to put them right
Reading a value from the wrong axis or ignoring the unit.
Put it right: Check the axis label and unit before quoting a number.
Treating a small numerical difference as significant without comparing orders of magnitude.
Put it right: Express both values as powers of ten and compare.
Describing a trend without quoting data.
Put it right: Support the description with at least two values from the chart, graph or table.
Exam tips
- Quote values with their units when extracting data, because unlabelled numbers are hard to credit.
- Show your order-of-magnitude comparison as a ratio or a difference in powers of ten so the reasoning is visible.
- If a graph has a non-linear scale, read intermediate values carefully rather than assuming equal spacing.
Try the lesson
The start of the Using the Earth's resources and sustainable development: Students should be able to: extract and interpret information about resources from charts, graphs and tables use orders of magnitude to evaluate the significance of data. lesson, made from checked teaching notes for this specification point.
Have a go first
A report states the mass of three resources used in a country in one year: coal 4.0 × 10⁸ tonnes, oil 2.0 × 10⁸ tonnes and timber 2.0 × 10⁶ tonnes. Which resource was used in the greatest mass?
Listen
Resource data are often presented in charts, graphs and tables showing reserves, production rates or consumption over time. To extract information, read the axes, units and key carefully, then locate the required value. To interpret, describe the trend and use the data to compare resources. Orders of magnitude express how many powers of ten separate two values. For example, 10³ is one order of magnitude larger than 10², and 10⁶ is four orders of magnitude larger than 10². Comparing orders of magnitude shows whether a difference is significant: a resource lasting 10⁶ years is far more abundant than one lasting 10² years, whereas 10² and 3 × 10² differ by less than one order of magnitude. This helps judge which resource is genuinely more plentiful or which change is meaningful. A strong answer earns marks for these points. Read the title, axes, units and key before extracting values from a chart, graph or table. Interpret a trend by describing whether values increase, decrease or remain constant and by quoting data points. An order of magnitude is a factor of 10, so 10³ is one order of magnitude greater than 10². Compare values by finding the ratio or the difference in powers of ten to judge significance. A common slip: Reading a value from the wrong axis or ignoring the unit. Instead, check the axis label and unit before quoting a number. Exam tip: Quote values with their units when extracting data, because unlabelled numbers are hard to credit.
See it
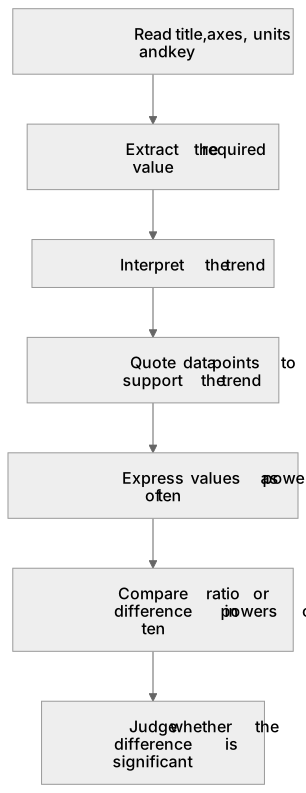
Put it in order
Put these steps in the order they happen.
- 1. Judge whether the difference is significant
- 2. Compare ratio or difference in powers of ten
- 3. Interpret the trend
- 4. Express values as powers of ten
- 5. Read title, axes, units and key
- 6. Extract the required value
- 7. Quote data points to support the trend
Key words
Say what each word means before you turn the card.
Data interpretation
Try answering aloud or in your head before turning the card.
Trend description
Try answering aloud or in your head before turning the card.
Orders of magnitude
Try answering aloud or in your head before turning the card.
Significance of evidence
Try answering aloud or in your head before turning the card.
See every definition
- Data interpretation
- Describing the trend in values from a chart, graph or table and using the data to compare resources.
- Trend description
- Saying whether values increase, decrease or remain constant and quoting data points to support it.
- Orders of magnitude
- How many powers of ten separate two values, where an order of magnitude is a factor of 10.
- Significance of evidence
- Judging whether a difference is significant by comparing orders of magnitude to see if it is large enough to matter.
Label the diagram
Some boxes have lost their names. Pick the right name for each number.
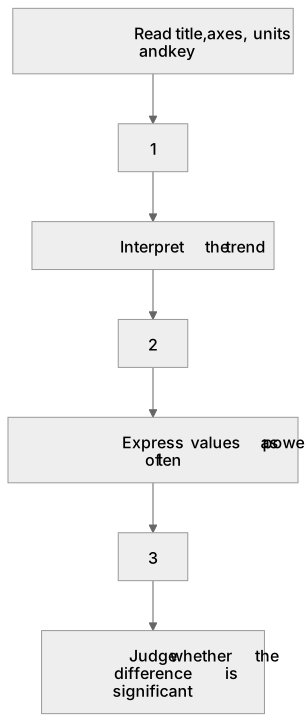
1Box 1
2Box 2
3Box 3
There is more to this lesson
The full lesson goes on to check your understanding and help you earn the marks. Create a free account to carry on, with your progress saved.
A week of Premium from your first lesson · Then the free plan continues · No card, no charge
Test your understanding of Using the Earth's resources and sustainable development: Students should be able to: extract and interpret information about resources from charts, graphs and tables use orders of magnitude to evaluate the significance of data.
Active recall beats re-reading. Take an instant quiz now to test what you’ve learned and lock it into long-term memory.
A week of Premium from your first lesson · Then the free plan continues · No card, no charge