AQA · GCSE · Combined Science
Course version: 8464 · Version from Sept 2018
Students should be able to extract and interpret information from charts,…
Full specification wording
Fossils: Students should be able to extract and interpret information from charts, graphs and tables such as evolutionary trees.
Evolutionary trees are branching diagrams showing how species or groups are related through common ancestors.
Checked against the AQA 8464 specification (opens in a new tab) on .
- Point 8 of 8
- 4 key terms
Study notes
From the checked teaching notes for this specification point.
The idea
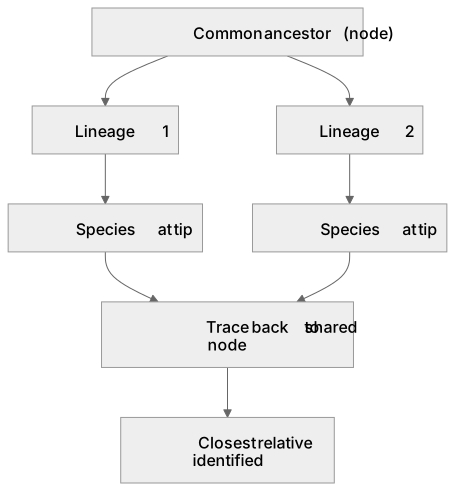
Evolutionary trees are branching diagrams showing how species or groups are related through common ancestors. The branching point, or node, represents a common ancestor; the tips represent species alive today or at a chosen time. Reading a tree involves tracing lines from a species back to a node, then following the other branch to find its closest relative. The number of branching points between two species indicates how recently they shared an ancestor, not how similar they look. Charts and tables may also show fossil ages or numbers of species, and these data can be read and compared to support conclusions about relationships and change over time.
What earns the marks
- Identify the branching points on an evolutionary tree and state that each represents a common ancestor of the lineages above it.
- Trace lines from two species back to their shared node to decide which species are most closely related.
- Interpret a table or graph of fossil ages or species numbers by reading values accurately and describing the trend shown.
- Use evidence from the chart, graph or table to support a conclusion about relationships or change, quoting specific values or labels.
- Recognise that a species at the tip of a branch is not necessarily more advanced than one on another branch; branching shows relatedness, not progress.
Common mistakes and how to put them right
Reading an evolutionary tree from left to right as a timeline of progress.
Put it right: The branching pattern shows common ancestry, and branch tips can represent the same time period.
Assuming species at the top of a tree are more evolved.
Put it right: Position on the page does not indicate superiority or greater complexity.
Confusing similarity of appearance with closeness of relationship.
Put it right: Analogous features can look alike without indicating a recent common ancestor.
Exam tips
- Name the node and the two species when explaining a relationship, for example 'species A and B share node X, so they are closely related'.
- When a graph or table is given, quote a value with its unit and use it in your answer rather than describing the shape vaguely.
- Check the axis labels and keys before reading values, because evolutionary trees and data tables often use symbols or abbreviations.
Try the lesson
The start of the Fossils: Students should be able to extract and interpret information from charts, graphs and tables such as evolutionary trees. lesson, made from checked teaching notes for this specification point.
Have a go first
An evolutionary tree shows that species A and species B share a common ancestor at point X. Species C branches off earlier. Which species are most closely related?
Listen
Evolutionary trees are branching diagrams showing how species or groups are related through common ancestors. The branching point, or node, represents a common ancestor; the tips represent species alive today or at a chosen time. Reading a tree involves tracing lines from a species back to a node, then following the other branch to find its closest relative. The number of branching points between two species indicates how recently they shared an ancestor, not how similar they look. Charts and tables may also show fossil ages or numbers of species, and these data can be read and compared to support conclusions about relationships and change over time. A strong answer earns marks for these points. Identify the branching points on an evolutionary tree and state that each represents a common ancestor of the lineages above it. Trace lines from two species back to their shared node to decide which species are most closely related. Interpret a table or graph of fossil ages or species numbers by reading values accurately and describing the trend shown. Use evidence from the chart, graph or table to support a conclusion about relationships or change, quoting specific values or labels. Exam tip: Name the node and the two species when explaining a relationship, for example 'species A and B share node X, so they are closely related'.
See it
Key words
Say what each word means before you turn the card.
Common ancestry
Try answering aloud or in your head before turning the card.
Interpreting evolutionary trees
Try answering aloud or in your head before turning the card.
Data interpretation from charts and tables
Try answering aloud or in your head before turning the card.
Evidence for relationships between organisms
Try answering aloud or in your head before turning the card.
See every definition
- Common ancestry
- The branching pattern of an evolutionary tree shows how species or groups are related through common ancestors.
- Interpreting evolutionary trees
- Tracing lines from a species back to a node, then following the other branch, shows its closest relative.
- Data interpretation from charts and tables
- Reading values accurately from charts and tables of fossil ages or species numbers and describing the trend shown.
- Evidence for relationships between organisms
- Evidence from a chart, graph or table can support a conclusion about relationships or change, quoting specific values or labels.
There is more to this lesson
The full lesson goes on to check your understanding and help you earn the marks. Create a free account to carry on, with your progress saved.
A week of Premium from your first lesson · Then the free plan continues · No card, no charge
Test your understanding of Fossils: Students should be able to extract and interpret information from charts, graphs and tables such as evolutionary trees.
Active recall beats re-reading. Take an instant quiz now to test what you’ve learned and lock it into long-term memory.
A week of Premium from your first lesson · Then the free plan continues · No card, no charge