AQA · GCSE · Combined Science
Course version: 8464 · Version from Sept 2018
Required practical activity 7: measure the population size of a common…
Full specification wording
Levels of organisation: Required practical activity 7: measure the population size of a common species in a habitat. Use sampling techniques to investigate the effect of a factor on the distribution of this species.
This practical develops two linked skills.
Checked against the AQA 8464 specification (opens in a new tab) on .
- Point 11 of 11
- 4 key terms
Study notes
From the checked teaching notes for this specification point.
The idea
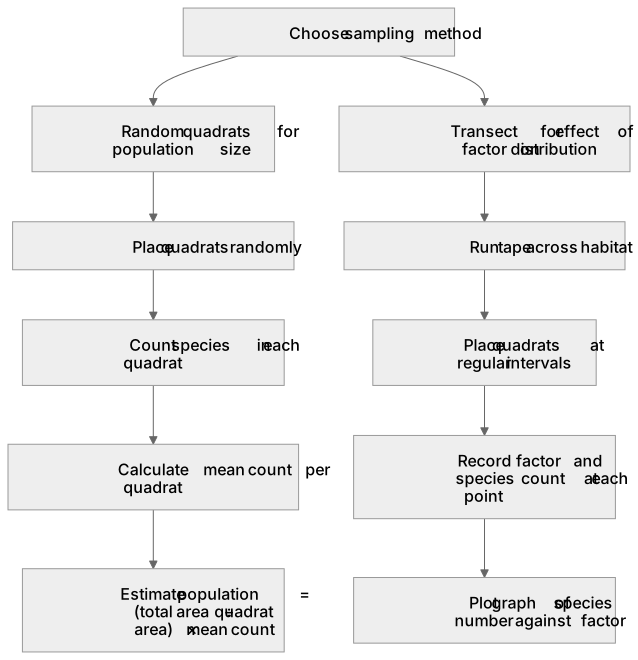
This practical develops two linked skills. First, estimate population size of a common species by sampling, for example using a quadrat to count daisies in a field. Place quadrats randomly, such as by using a random number generator to select coordinates, count individuals in each quadrat, then scale up: estimated population = (total area ÷ quadrat area) × mean count per quadrat. Second, investigate how an abiotic factor, such as light intensity, affects distribution. Use a transect: run a tape across the habitat and place quadrats at regular intervals, recording the factor and the species count at each point. This shows whether the species becomes more or less abundant as the factor changes. Sampling avoids counting every organism, which is often impossible, but it must be random or systematic to reduce bias and be repeated to improve reliability.
What earns the marks
- Selects an appropriate sampling method: random quadrat placement for population size, or a transect for investigating distribution along an environmental gradient.
- Uses a quadrat of known area and counts the species consistently, including a clear rule for organisms on the boundary.
- Collects sufficient repeat samples and calculates a mean count per quadrat before scaling to the whole habitat area.
- Measures the chosen factor, such as light intensity with a light meter, at each sampling point and records paired data.
- Processes data appropriately, for example estimating population size = (total area ÷ quadrat area) × mean count, or plotting a graph of species number against the factor.
- Evaluates limitations, such as quadrat size, sample number, random placement and time of day, and suggests improvements.
Common mistakes and how to put them right
Placing quadrats only where the species is obvious.
Put it right: Use random coordinates or a regular transect so every part of the habitat has a chance of being sampled.
Forgetting to convert units when scaling up, for example mixing cm² and m².
Put it right: Convert all areas to the same unit before calculating estimated population size.
Recording only the species count and ignoring the factor being investigated.
Put it right: Measure and record the factor at each quadrat so the effect on distribution can be analysed.
Exam tips
- State clearly whether you are estimating population size or investigating distribution, because the sampling method differs.
- Show the scaling calculation with units, for example estimated population = (100 m² ÷ 0.25 m²) × 12 = 4800.
- When describing improvements, link each one to the problem it reduces, such as more quadrats to reduce the effect of chance.
Try the lesson
The start of the Levels of organisation: Required practical activity 7: measure the population size of a common species in a habitat. Use sampling techniques to investigate the effect of a factor on the distribution of this species. lesson, made from checked teaching notes for this specification point.
Have a go first
In required practical activity 7, a student places a 0.25 m² quadrat on the ground and counts 12 daisies inside it. What is the population density of daisies in this quadrat?
Listen
This practical develops two linked skills. First, estimate population size of a common species by sampling, for example using a quadrat to count daisies in a field. Place quadrats randomly, such as by using a random number generator to select coordinates, count individuals in each quadrat, then scale up: estimated population = (total area ÷ quadrat area) × mean count per quadrat. Second, investigate how an abiotic factor, such as light intensity, affects distribution. Use a transect: run a tape across the habitat and place quadrats at regular intervals, recording the factor and the species count at each point. This shows whether the species becomes more or less abundant as the factor changes. Sampling avoids counting every organism, which is often impossible, but it must be random or systematic to reduce bias and be repeated to improve reliability. A strong answer earns marks for these points. Selects an appropriate sampling method: random quadrat placement for population size, or a transect for investigating distribution along an environmental gradient. Uses a quadrat of known area and counts the species consistently, including a clear rule for organisms on the boundary. Collects sufficient repeat samples and calculates a mean count per quadrat before scaling to the whole habitat area. Measures the chosen factor, such as light intensity with a light meter, at each sampling point and records paired data. A common slip: Placing quadrats only where the species is obvious: this biases results. Instead, use random coordinates or a regular transect so every part of the habitat has a chance of being sampled. Exam tip: State clearly whether you are estimating population size or investigating distribution, because the sampling method differs.
See it
Key words
Say what each word means before you turn the card.
Sampling and estimation
Try answering aloud or in your head before turning the card.
Random and systematic sampling
Try answering aloud or in your head before turning the card.
Abiotic factors and species distribution
Try answering aloud or in your head before turning the card.
Reliability, bias and data processing
Try answering aloud or in your head before turning the card.
See every definition
- Sampling and estimation
- Counting a common species in quadrats rather than every organism, then scaling the mean count up to the whole habitat area.
- Random and systematic sampling
- Placing quadrats randomly, such as by using a random number generator to select coordinates, or along a transect at regular intervals.
- Abiotic factors and species distribution
- Recording a factor such as light intensity at each sampling point to show whether the species becomes more or less abundant as the factor changes.
- Reliability, bias and data processing
- Repeating samples to improve reliability, sampling randomly or systematically to reduce bias, and calculating a mean count or plotting a graph.
Label the diagram
Some boxes have lost their names. Pick the right name for each number.
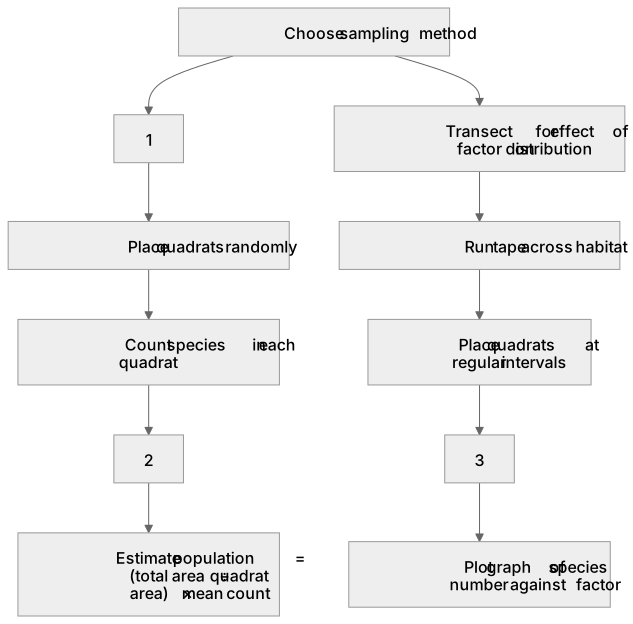
1Box 1
2Box 2
3Box 3
There is more to this lesson
The full lesson goes on to check your understanding and help you earn the marks. Create a free account to carry on, with your progress saved.
A week of Premium from your first lesson · Then the free plan continues · No card, no charge
Test your understanding of Levels of organisation: Required practical activity 7: measure the population size of a common species in a habitat. Use sampling techniques to investigate the effect of a factor on the distribution of this species.
Active recall beats re-reading. Take an instant quiz now to test what you’ve learned and lock it into long-term memory.
A week of Premium from your first lesson · Then the free plan continues · No card, no charge