AQA · GCSE · Combined Science
Course version: 8464 · Version from Sept 2018
Students should be able to interpret graphs used to model these cycles.
Full specification wording
Levels of organisation: Students should be able to interpret graphs used to model these cycles.
Predator-prey cycles are often shown as line graphs with time on the x-axis and population size on the y-axis.
Checked against the AQA 8464 specification (opens in a new tab) on .
- Point 10 of 11
Study notes
From the checked teaching notes for this specification point.
The idea
Predator-prey cycles are often shown as line graphs with time on the x-axis and population size on the y-axis. Two lines are plotted, one for the predator and one for the prey. To interpret such a graph, read the axes and key first, then trace each line. Identify peaks and troughs and note which line peaks first. The prey line usually peaks before the predator line, because predators need time to find more food, survive and reproduce. Where the prey line falls, the predator line often rises shortly afterwards, and where the predator line is high, the prey line falls. Compare the heights of peaks and depths of troughs to judge the size of each population. Use the graph to describe trends and to explain the link between the two populations.
What earns the marks
- Reads the axes and key correctly, identifying time on the x-axis and population size on the y-axis and matching each line to its organism.
- Identifies peaks and troughs on both lines and states which population is larger at a given time.
- Recognises that the prey population peaks before the predator population, showing a time lag.
- Links a rise in predator numbers to a later fall in prey numbers, and a fall in predator numbers to a later recovery of prey.
- Describes the overall pattern as repeating cycles rather than a single change.
- Uses data from the graph, such as values at a stated time, to support the interpretation.
Common mistakes and how to put them right
Mixing up the two lines.
Put it right: Check the key and label each line before describing any trend.
Reading the x-axis as population size.
Put it right: Population size is on the y-axis and time is on the x-axis.
Claiming the lines rise and fall together.
Put it right: The predator line lags behind the prey line, so their peaks occur at different times.
Exam tips
- Quote specific values or dates from the graph to support each point you make.
- Use comparative language such as higher, lower, steeper and later when describing the two lines.
- If asked to explain, link each change in the predator line to a change in food supply from the prey.
Try the lesson
The start of the Levels of organisation: Students should be able to interpret graphs used to model these cycles. lesson, made from checked teaching notes for this specification point.
Have a go first
A graph models a predator-prey cycle. It shows how the numbers of owls and mice change over several years. The line for the mice goes down, and shortly afterwards the line for the owls also goes down. What does the line for the owls going down show?
Listen
Predator-prey cycles are often shown as line graphs with time on the x-axis and population size on the y-axis. Two lines are plotted, one for the predator and one for the prey. To interpret such a graph, read the axes and key first, then trace each line. Identify peaks and troughs and note which line peaks first. The prey line usually peaks before the predator line, because predators need time to find more food, survive and reproduce. Where the prey line falls, the predator line often rises shortly afterwards, and where the predator line is high, the prey line falls. Compare the heights of peaks and depths of troughs to judge the size of each population. Use the graph to describe trends and to explain the link between the two populations. A strong answer earns marks for these points. Reads the axes and key correctly, identifying time on the x-axis and population size on the y-axis and matching each line to its organism. Identifies peaks and troughs on both lines and states which population is larger at a given time. Recognises that the prey population peaks before the predator population, showing a time lag. Links a rise in predator numbers to a later fall in prey numbers, and a fall in predator numbers to a later recovery of prey. A common slip: Mixing up the two lines. Instead, check the key and label each line before describing any trend. Exam tip: Quote specific values or dates from the graph to support each point you make.
See it
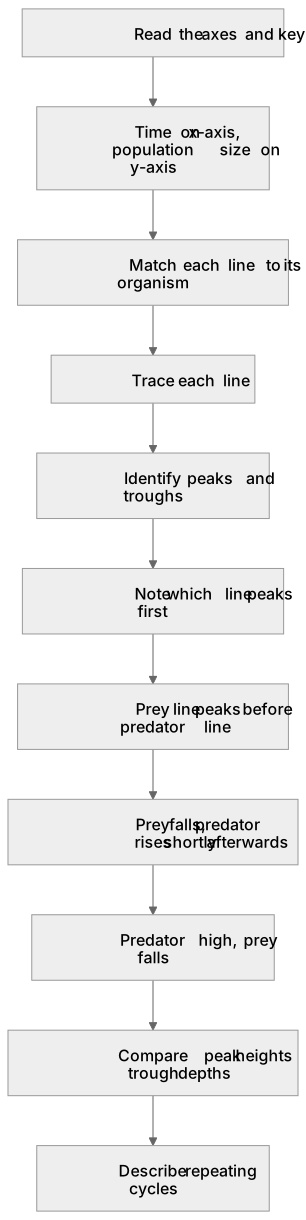
Label the diagram
Some boxes have lost their names. Pick the right name for each number.
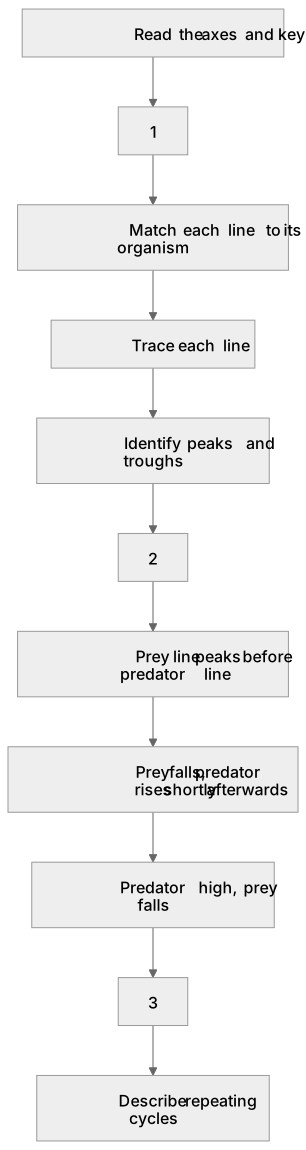
1Box 1
2Box 2
3Box 3
There is more to this lesson
The full lesson goes on to check your understanding and help you earn the marks. Create a free account to carry on, with your progress saved.
A week of Premium from your first lesson · Then the free plan continues · No card, no charge
Test your understanding of Levels of organisation: Students should be able to interpret graphs used to model these cycles.
Active recall beats re-reading. Take an instant quiz now to test what you’ve learned and lock it into long-term memory.
A week of Premium from your first lesson · Then the free plan continues · No card, no charge