AQA · GCSE · Combined Science
Course version: 8464 · Version from Sept 2018
Students should be able to draw conclusions from given data about the…
Full specification wording
Properties of electromagnetic waves 2: Students should be able to draw conclusions from given data about the risks and consequences of exposure to radiation.
This skill requires you to interpret data, such as tables or graphs of dose against cancer incidence, and reach a justified conclusion about the risks and consequences of radiation exposure.
Checked against the AQA 8464 specification (opens in a new tab) on .
- Point 6 of 7
- 4 key terms
Study notes
From the checked teaching notes for this specification point.
The idea
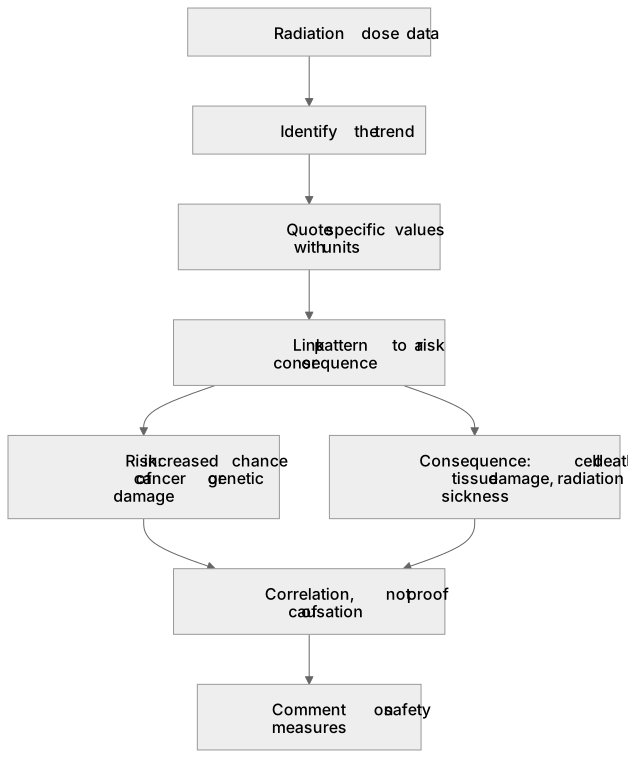
This skill requires you to interpret data, such as tables or graphs of dose against cancer incidence, and reach a justified conclusion about the risks and consequences of radiation exposure. Risks include an increased chance of cancer or genetic damage; consequences include cell death, tissue damage, radiation sickness at high doses and long-term health effects. A strong answer identifies the pattern in the data, quotes specific values, and links them to a biological effect.
For example: If a graph shows that cancer incidence rises from 20 cases per 10 000 people at 5 mSv to 40 cases per 10 000 people at 20 mSv, you can conclude that a fourfold increase in dose is associated with a doubling of cancer incidence, while noting that the data show a correlation and do not by themselves prove causation.
What earns the marks
- Describe the trend shown by the data, such as an increase in cancer incidence as radiation dose increases.
- Quote specific numerical values from the data to support the conclusion, including units where given.
- Link the data pattern to a named risk, such as an increased chance of cancer, or to a consequence, such as cell death or tissue damage.
- Recognise that data show correlation and that other factors may contribute, so causation should not be assumed without further evidence.
- Compare different groups, doses or time periods in the data and state which carries the greater risk.
- Use the conclusion to comment on safety measures, such as limiting exposure time, increasing distance or using shielding.
Common mistakes and how to put them right
Stating that radiation definitely causes cancer in an individual because the data show a correlation.
Put it right: The data show a statistical association across a population, not proof that a particular person's cancer was caused by the exposure.
Describing the data without drawing a conclusion, for example listing every value in a table.
Put it right: Select the key pattern and use only the figures that support your conclusion.
Confusing risk with consequence.
Put it right: Risk is the probability or chance of harm occurring, while consequence is the harm itself, such as tissue damage or cancer.
Exam tips
- Start your answer with a clear conclusion, then support it with at least one specific figure from the data.
- Use comparative language such as higher, lower, greater or smaller, and quote the values being compared.
- If the data are uncertain or limited, say so and explain how more evidence would strengthen the conclusion.
Try the lesson
The start of the Properties of electromagnetic waves 2: Students should be able to draw conclusions from given data about the risks and consequences of exposure to radiation. lesson, made from checked teaching notes for this specification point.
Have a go first
A study investigated the link between the number of years radiographers worked with X-rays and the percentage who developed a specific illness. The results showed: 5 years (1.2%), 10 years (2.1%), 15 years (3.5%), and 20 years (5.0%). Which conclusion is best supported by this data?
Listen
This skill requires you to interpret data, such as tables or graphs of dose against cancer incidence, and reach a justified conclusion about the risks and consequences of radiation exposure. Risks include an increased chance of cancer or genetic damage; consequences include cell death, tissue damage, radiation sickness at high doses and long-term health effects. A strong answer identifies the pattern in the data, quotes specific values, and links them to a biological effect. For example, if a graph shows that cancer incidence rises from 20 cases per 10 000 people at 5 mSv to 40 cases per 10 000 people at 20 mSv, you can conclude that a fourfold increase in dose is associated with a doubling of cancer incidence, while noting that the data show a correlation and do not by themselves prove causation. A strong answer earns marks for these points. Describe the trend shown by the data, such as an increase in cancer incidence as radiation dose increases. Quote specific numerical values from the data to support the conclusion, including units where given. Link the data pattern to a named risk, such as an increased chance of cancer, or to a consequence, such as cell death or tissue damage. Recognise that data show correlation and that other factors may contribute, so causation should not be assumed without further evidence. A common slip: Stating that radiation definitely causes cancer in an individual because the data show a correlation. Instead, the data show a statistical association across a population, not proof that a particular person's cancer was caused by the exposure. Exam tip: Start your answer with a clear conclusion, then support it with at least one specific figure from the data.
See it
Key words
Say what each word means before you turn the card.
Risk
Try answering aloud or in your head before turning the card.
Consequence
Try answering aloud or in your head before turning the card.
Correlation
Try answering aloud or in your head before turning the card.
Causation
Try answering aloud or in your head before turning the card.
See every definition
- Risk
- The probability or chance of harm occurring, such as an increased chance of cancer or genetic damage from radiation exposure.
- Consequence
- The harm itself, such as cell death, tissue damage, radiation sickness at high doses and long-term health effects.
- Correlation
- A statistical association shown by data across a population, which does not by itself prove causation.
- Causation
- A proven cause-and-effect relationship, which should not be assumed from data showing correlation without further evidence.
Label the diagram
Some boxes have lost their names. Pick the right name for each number.
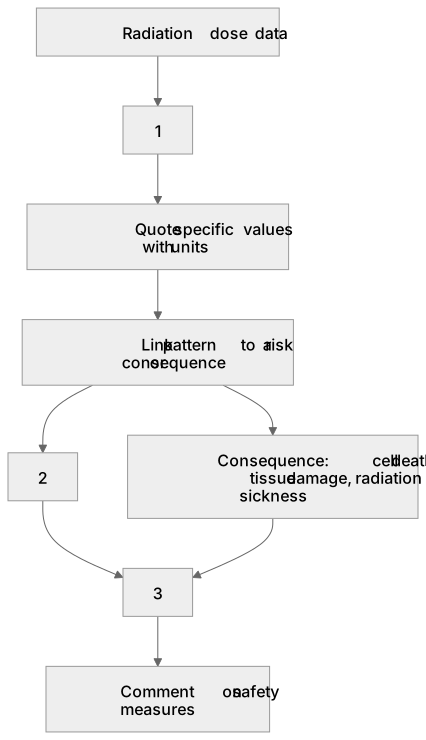
1Box 1
2Box 2
3Box 3
There is more to this lesson
The full lesson goes on to check your understanding and help you earn the marks. Create a free account to carry on, with your progress saved.
A week of Premium from your first lesson · Then the free plan continues · No card, no charge
Test your understanding of Properties of electromagnetic waves 2: Students should be able to draw conclusions from given data about the risks and consequences of exposure to radiation.
Active recall beats re-reading. Take an instant quiz now to test what you’ve learned and lock it into long-term memory.
A week of Premium from your first lesson · Then the free plan continues · No card, no charge