AQA · GCSE · Combined Science
Course version: 8464 · Version from Sept 2018
Required practical activity 5: investigate the effect of light intensity…
Full specification wording
Rate of photosynthesis: Required practical activity 5: investigate the effect of light intensity on the rate of photosynthesis using an aquatic organism such as pondweed.
In this required practical, pondweed is placed in water with a light source at a measured distance.
Checked against the AQA 8464 specification (opens in a new tab) on .
- Point 10 of 10
- 4 key terms
Study notes
From the checked teaching notes for this specification point.
The idea
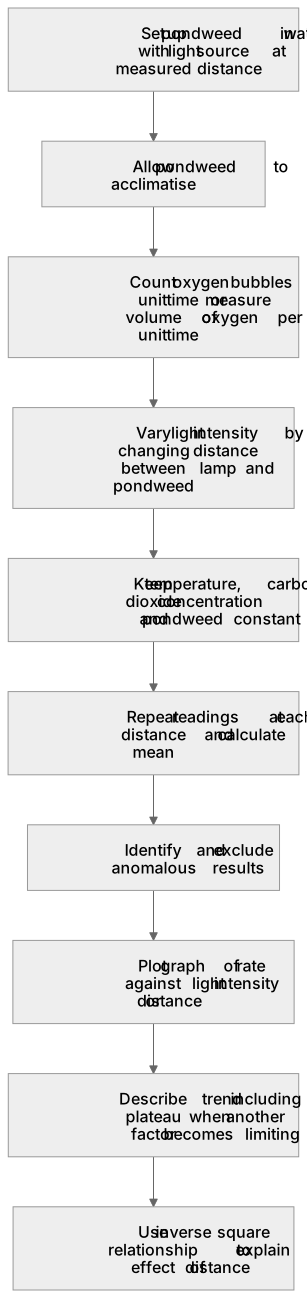
In this required practical, pondweed is placed in water with a light source at a measured distance. As the pondweed photosynthesises, oxygen bubbles are released and counted, or the volume of gas collected is measured over a set time. Light intensity is varied by changing the distance between the lamp and the pondweed; light intensity is inversely proportional to the square of the distance. The rate of photosynthesis is indicated by the number of bubbles per minute or the volume of oxygen per minute. Control variables include temperature, carbon dioxide concentration and the pondweed itself. A graph of rate against light intensity typically rises and then plateaus when another factor becomes limiting.
What earns the marks
- Sets up pondweed in water with a light source at a measured distance and allows time for the plant to acclimatise before counting bubbles.
- Varies light intensity by changing the distance between the lamp and the pondweed, using a ruler or metre rule to measure distance accurately.
- Counts oxygen bubbles released per unit time or collects and measures the volume of oxygen produced per unit time as a measure of the rate of photosynthesis.
- Controls variables such as temperature, carbon dioxide concentration and the size or type of pondweed to ensure a valid comparison.
- Repeats readings at each distance and calculates a mean, identifying and excluding anomalous results where appropriate.
- Plots a graph of rate of photosynthesis against light intensity or distance and describes the trend, including any plateau when another factor becomes limiting.
- Uses the inverse square relationship between light intensity and distance to explain why moving the lamp further away reduces the rate.
Common mistakes and how to put them right
Starting to count bubbles immediately after setting up the apparatus.
Put it right: Allow the pondweed to acclimatise for a few minutes so that the rate is steady before taking measurements.
Changing more than one variable at a time, such as moving the lamp and altering the temperature.
Put it right: Change only the distance between lamp and pondweed while keeping temperature, CO₂ concentration and pondweed size constant.
Recording a single bubble count as the result.
Put it right: Take repeat readings at each distance and calculate a mean to improve reliability.
Assuming light intensity is directly proportional to distance.
Put it right: Light intensity is inversely proportional to the square of the distance, so doubling the distance reduces intensity to one quarter.
Exam tips
- State clearly how the dependent variable is measured, for example bubbles per minute or cm³ of oxygen per minute.
- When describing the graph, refer to the initial rise and the plateau, and name the factor that may become limiting at the plateau.
- Use the inverse square relationship to explain why the rate falls as the lamp is moved further away.
- Mention repeats and means when asked how to improve the investigation, and identify control variables explicitly.
Try the lesson
The start of the Rate of photosynthesis: Required practical activity 5: investigate the effect of light intensity on the rate of photosynthesis using an aquatic organism such as pondweed. lesson, made from checked teaching notes for this specification point.
Have a go first
In the pondweed practical, what is counted to measure the rate of photosynthesis?
Listen
In this required practical, pondweed is placed in water with a light source at a measured distance. As the pondweed photosynthesises, oxygen bubbles are released and counted, or the volume of gas collected is measured over a set time. Light intensity is varied by changing the distance between the lamp and the pondweed; light intensity is inversely proportional to the square of the distance. The rate of photosynthesis is indicated by the number of bubbles per minute or the volume of oxygen per minute. Control variables include temperature, carbon dioxide concentration and the pondweed itself. A graph of rate against light intensity typically rises and then plateaus when another factor becomes limiting. A strong answer earns marks for these points. Sets up pondweed in water with a light source at a measured distance and allows time for the plant to acclimatise before counting bubbles. Varies light intensity by changing the distance between the lamp and the pondweed, using a ruler or metre rule to measure distance accurately. Counts oxygen bubbles released per unit time or collects and measures the volume of oxygen produced per unit time as a measure of the rate of photosynthesis. Controls variables such as temperature, carbon dioxide concentration and the size or type of pondweed to ensure a valid comparison. A common slip: starting to count bubbles immediately after setting up the apparatus. Instead, allow the pondweed to acclimatise for a few minutes so that the rate is steady before taking measurements. Exam tip: State clearly how the dependent variable is measured, for example bubbles per minute or cm³ of oxygen per minute.
See it
Key words
Say what each word means before you turn the card.
Rate of photosynthesis
Try answering aloud or in your head before turning the card.
Light intensity
Try answering aloud or in your head before turning the card.
Control variables
Try answering aloud or in your head before turning the card.
Repeats
Try answering aloud or in your head before turning the card.
See every definition
- Rate of photosynthesis
- Indicated by the number of bubbles per minute or the volume of oxygen per minute.
- Light intensity
- Varies by changing the distance between the lamp and the pondweed, and is inversely proportional to the square of the distance.
- Control variables
- Include temperature, carbon dioxide concentration and the pondweed itself.
- Repeats
- Readings taken at each distance, with a mean calculated and anomalous results identified and excluded where appropriate.
Label the diagram
Some boxes have lost their names. Pick the right name for each number.
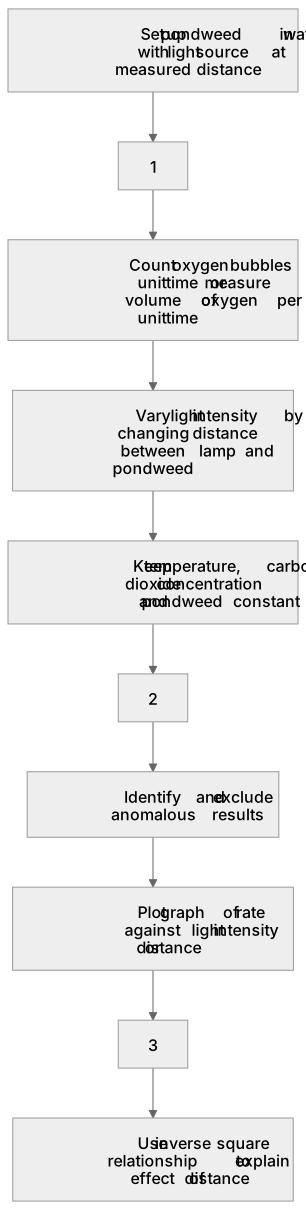
1Box 1
2Box 2
3Box 3
There is more to this lesson
The full lesson goes on to check your understanding and help you earn the marks. Create a free account to carry on, with your progress saved.
A week of Premium from your first lesson · Then the free plan continues · No card, no charge
Test your understanding of Rate of photosynthesis: Required practical activity 5: investigate the effect of light intensity on the rate of photosynthesis using an aquatic organism such as pondweed.
Active recall beats re-reading. Take an instant quiz now to test what you’ve learned and lock it into long-term memory.
A week of Premium from your first lesson · Then the free plan continues · No card, no charge