Pearson Edexcel · A-Level · Economics B
Course version: 9EB0 · Version from Sept 2015
Demand: b) The demand curve
The demand curve is a graphical representation of the relationship between the price of a good or service and the quantity demanded by consumers over a given period, ceteris paribus.
Checked against the Pearson Edexcel 9EB0 specification (opens in a new tab) on .
- Point 2 of 4
Study notes
From the checked teaching notes for this specification point.
The idea
The demand curve is a graphical representation of the relationship between the price of a good or service and the quantity demanded by consumers over a given period, ceteris paribus. It typically slopes downwards from left to right, illustrating the law of demand: as price falls, the quantity demanded increases, and as price rises, the quantity demanded decreases. For example, if the price of a smartphone drops from £800 to £600, consumers are willing and able to buy more units, which is plotted as a downward-sloping line on a graph with price on the vertical axis and quantity on the horizontal axis. This curve helps businesses and economists visualise consumer behaviour and market potential.
What earns the marks
- A demand curve shows the inverse relationship between price and quantity demanded.
- Price is plotted on the vertical axis and quantity demanded on the horizontal axis.
- The curve slopes downwards from left to right, reflecting the law of demand.
Common mistakes and how to put them right
Plotting quantity on the vertical axis and price on the horizontal axis.
Put it right: Place price on the vertical axis and quantity on the horizontal axis.
Drawing an upward-sloping demand curve.
Put it right: Demand curves typically slope downwards to reflect the inverse relationship between price and quantity.
Confusing the demand curve with the amount actually bought.
Put it right: The curve represents the quantity consumers are willing and able to buy at various prices, not the final sales volume.
Exam tips
- Always label your axes clearly with 'Price' and 'Quantity' when drawing a demand curve.
- Label the demand curve itself with a 'D' to distinguish it from other curves on the same diagram.
- Use a ruler to draw a straight-line demand curve unless the data specifically requires a non-linear curve.
Try the lesson
The start of the Demand: b) The demand curve lesson, made from checked teaching notes for this specification point.
Have a go first
Which of the following best describes what a standard market demand curve illustrates?
Listen
The demand curve is a graphical representation of the relationship between the price of a good or service and the quantity demanded by consumers over a given period, ceteris paribus. It typically slopes downwards from left to right, illustrating the law of demand: as price falls, the quantity demanded increases, and as price rises, the quantity demanded decreases. For example, if the price of a smartphone drops from £800 to £600, consumers are willing and able to buy more units, which is plotted as a downward-sloping line on a graph with price on the vertical axis and quantity on the horizontal axis. This curve helps businesses and economists visualise consumer behaviour and market potential. A strong answer earns marks for these points. A demand curve shows the inverse relationship between price and quantity demanded. Price is plotted on the vertical axis and quantity demanded on the horizontal axis. The curve slopes downwards from left to right, reflecting the law of demand. Exam tip: Always label your axes clearly with 'Price' and 'Quantity' when drawing a demand curve.
See it
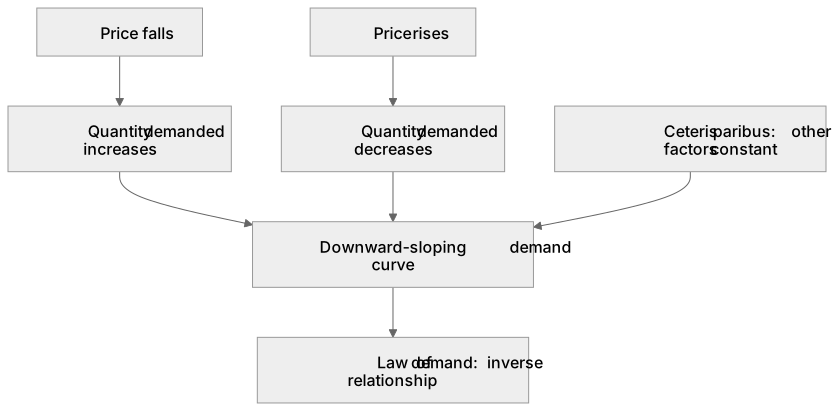
Label the diagram
Some boxes have lost their names. Pick the right name for each number.
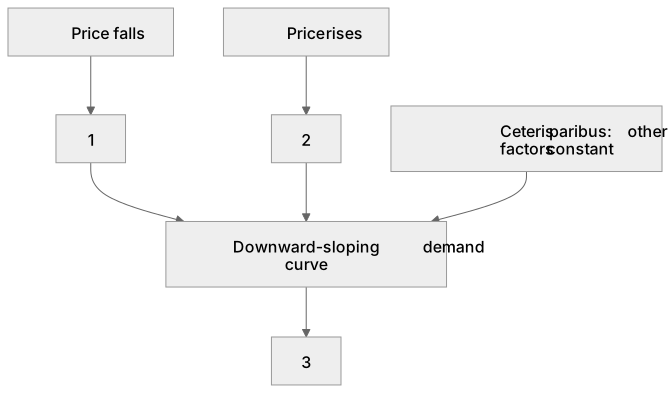
1Box 1
2Box 2
3Box 3
There is more to this lesson
The full lesson goes on to check your understanding and help you earn the marks. Create a free account to carry on, with your progress saved.
A week of Premium from your first lesson · Then the free plan continues · No card, no charge
Test your understanding of Demand: b) The demand curve
Active recall beats re-reading. Take an instant quiz now to test what you’ve learned and lock it into long-term memory.
A week of Premium from your first lesson · Then the free plan continues · No card, no charge