Pearson Edexcel · A-Level · Economics B
Course version: 9EB0 · Version from Sept 2015
The relationship between revenue and costs: d) Margin of safety
Full specification wording
The relationship between revenue and costs: d) Margin of safety
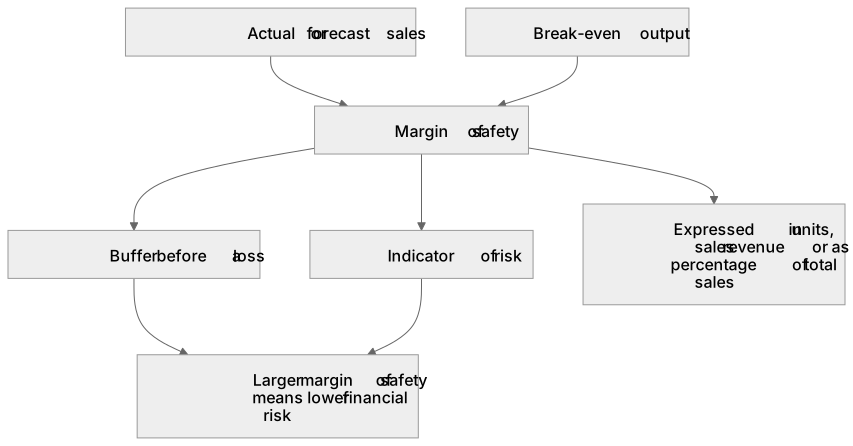
The margin of safety represents the difference between a business's current or expected sales volume and its break-even output.
Checked against the Pearson Edexcel 9EB0 specification (opens in a new tab) on .
- Point 4 of 5
- 3 key terms
Study notes
From the checked teaching notes for this specification point.
The idea
The margin of safety represents the difference between a business's current or expected sales volume and its break-even output. It measures how much sales can fall before the business begins to incur a loss, providing a crucial indicator of risk. For example, if a firm sells 5,000 units and its break-even point is 3,000 units, the margin of safety is 2,000 units. It can be expressed in units, sales revenue, or as a percentage of total sales. A larger margin of safety indicates lower financial risk, giving the business a buffer against unexpected downturns in demand or increases in costs. Managers use this metric to assess the viability of new projects, set sales targets, and make informed decisions about pricing and cost control.
What earns the marks
- Define margin of safety as the difference between actual or forecast sales and the break-even level of output.
- Calculate the margin of safety using the formula: Actual Sales minus Break-even Sales.
- Interpret a positive margin of safety as the buffer a business has before making a financial loss.
- Explain how changes in selling price, variable costs per unit, or total fixed costs affect the margin of safety.
Common mistakes and how to put them right
Confusing margin of safety with profit margin.
Put it right: Margin of safety measures the volume of sales above break-even, whereas profit margin measures profit as a proportion of revenue.
Calculating margin of safety using revenue instead of units without specifying the unit of measurement.
Put it right: State whether the margin of safety is in units or revenue, and use the appropriate formula for each.
Assuming a high margin of safety guarantees high profits.
Put it right: A high margin of safety only indicates a lower risk of making a loss; actual profit depends on the absolute level of contribution and fixed costs.
Exam tips
- Always show your working when calculating the margin of safety, including the initial break-even calculation if required.
- When interpreting a break-even chart, identify the margin of safety as the horizontal distance between the current output level and the break-even point.
- Use the margin of safety to evaluate the risk associated with different business decisions, such as launching a new product or entering a new market.
Try the lesson
The start of the The relationship between revenue and costs: d) Margin of safety lesson, made from checked teaching notes for this specification point.
Have a go first
A retailer expects to sell 8,000 units of a product next month. The calculated break-even point for the product is 5,000 units. What is the margin of safety?
Listen
The margin of safety represents the difference between a business's current or expected sales volume and its break-even output. It measures how much sales can fall before the business begins to incur a loss, providing a crucial indicator of risk. For example, if a firm sells 5,000 units and its break-even point is 3,000 units, the margin of safety is 2,000 units. It can be expressed in units, sales revenue, or as a percentage of total sales. A larger margin of safety indicates lower financial risk, giving the business a buffer against unexpected downturns in demand or increases in costs. Managers use this metric to assess the viability of new projects, set sales targets, and make informed decisions about pricing and cost control. A strong answer earns marks for these points. Define margin of safety as the difference between actual or forecast sales and the break-even level of output. Calculate the margin of safety using the formula: Actual Sales minus Break-even Sales. Interpret a positive margin of safety as the buffer a business has before making a financial loss. Explain how changes in selling price, variable costs per unit, or total fixed costs affect the margin of safety. A common slip: Confusing margin of safety with profit margin. Instead, Margin of safety measures the volume of sales above break-even, whereas profit margin measures profit as a proportion of revenue. Exam tip: Always show your working when calculating the margin of safety, including the initial break-even calculation if required.
See it
Key words
Say what each word means before you turn the card.
Margin of safety
Try answering aloud or in your head before turning the card.
Break-even output
Try answering aloud or in your head before turning the card.
Financial risk
Try answering aloud or in your head before turning the card.
See every definition
- Margin of safety
- The difference between a business's current or expected sales volume and its break-even output, measuring how much sales can fall before the business begins to incur a loss.
- Break-even output
- The level of output from which the margin of safety is measured, being the point at which the business does not yet begin to incur a loss.
- Financial risk
- The risk of making a loss, which a larger margin of safety indicates is lower, giving the business a buffer against unexpected downturns in demand or increases in costs.
Label the diagram
Some boxes have lost their names. Pick the right name for each number.
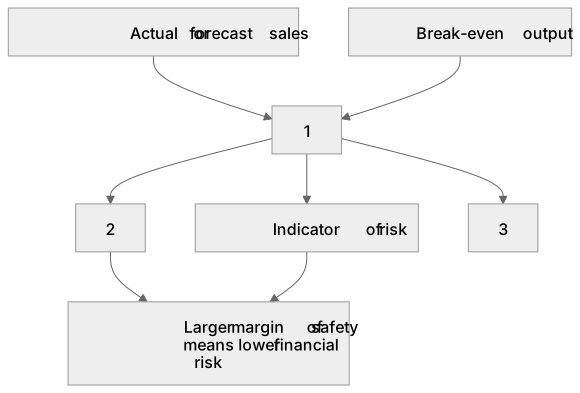
1Box 1
2Box 2
3Box 3
There is more to this lesson
The full lesson goes on to check your understanding and help you earn the marks. Create a free account to carry on, with your progress saved.
A week of Premium from your first lesson · Then the free plan continues · No card, no charge
Test your understanding of The relationship between revenue and costs: d) Margin of safety
Active recall beats re-reading. Take an instant quiz now to test what you’ve learned and lock it into long-term memory.
A week of Premium from your first lesson · Then the free plan continues · No card, no charge