AQA · A-Level · Geography
Course version: 7037 · Version from Sept 2018
Graphical skills: Line graphs – simple, comparative, compound and divergent.
Line graphs display continuous data over time or distance, highlighting trends and fluctuations.
Checked against the AQA 7037 specification (opens in a new tab) on .
- Point 1 of 7
- 4 key terms
Study notes
From the checked teaching notes for this specification point.
The idea
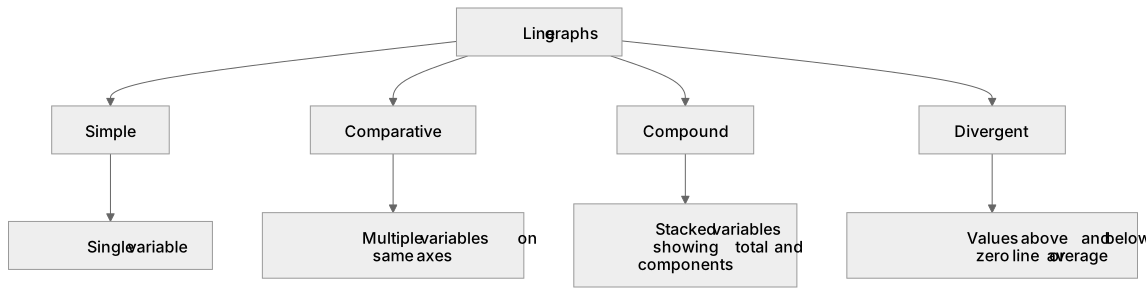
Line graphs display continuous data over time or distance, highlighting trends and fluctuations. Simple line graphs plot a single variable, such as annual rainfall. Comparative line graphs display multiple variables on the same axes, allowing direct comparison, like birth and death rates in the Demographic Transition Model. Compound line graphs stack variables to show both the total and the proportional breakdown of components, such as total energy generation divided into coal, gas, and renewables. Divergent line graphs plot values above and below a zero line or average, effectively illustrating positive and negative changes, such as net migration or temperature anomalies. Each type requires careful axis scaling to avoid distortion.
What earns the marks
- Extract precise data points and identify overall trends or anomalies from various line graphs.
- Construct comparative line graphs using a clear key to distinguish between multiple data series.
- Interpret compound line graphs by calculating the difference between stacked lines to find individual component values.
- Analyse divergent line graphs to identify periods of positive and negative growth relative to a baseline.
Common mistakes and how to put them right
Reading the top line of a compound graph as the value for that specific category.
Put it right: Calculate the value of a category in a compound graph by subtracting the value of the line below it from the line above it.
Failing to recognise the zero line on a divergent graph.
Put it right: Locate the zero axis first to correctly identify whether values represent positive or negative figures.
Using a line graph for discrete, unconnected categories.
Put it right: Only use line graphs for continuous data, such as time or distance along a transect.
Exam tips
- When describing trends from a comparative line graph, explicitly state where the lines intersect, as this often represents a critical geographical shift.
- Use a ruler in the exam to read exact values from the y-axis, especially on compound graphs where you must calculate the difference between lines.
- Pay close attention to the y-axis scale on divergent graphs, noting whether the intervals above and below zero are symmetrical.
Try the lesson
The start of the Graphical skills: Line graphs – simple, comparative, compound and divergent. lesson, made from checked teaching notes for this specification point.
Have a go first
A student is graphing the annual net migration of a country over a decade, which includes years of both net immigration and net emigration. Which type of line graph is specifically designed to show these values fluctuating above and below a zero baseline?
Listen
Line graphs display continuous data over time or distance, highlighting trends and fluctuations. Simple line graphs plot a single variable, such as annual rainfall. Comparative line graphs display multiple variables on the same axes, allowing direct comparison, like birth and death rates in the Demographic Transition Model. Compound line graphs stack variables to show both the total and the proportional breakdown of components, such as total energy generation divided into coal, gas, and renewables. Divergent line graphs plot values above and below a zero line or average, effectively illustrating positive and negative changes, such as net migration or temperature anomalies. Each type requires careful axis scaling to avoid distortion. A strong answer earns marks for these points. Extract precise data points and identify overall trends or anomalies from various line graphs. Construct comparative line graphs using a clear key to distinguish between multiple data series. Interpret compound line graphs by calculating the difference between stacked lines to find individual component values. Analyse divergent line graphs to identify periods of positive and negative growth relative to a baseline. A common slip: Reading the top line of a compound graph as the value for that specific category. Instead, Calculate the value of a category in a compound graph by subtracting the value of the line below it from the line above it. Exam tip: When describing trends from a comparative line graph, explicitly state where the lines intersect, as this often represents a critical geographical shift.
See it
Key words
Say what each word means before you turn the card.
Comparative line graphs
Try answering aloud or in your head before turning the card.
Compound line graphs
Try answering aloud or in your head before turning the card.
Divergent line graphs
Try answering aloud or in your head before turning the card.
Simple line graphs
Try answering aloud or in your head before turning the card.
See every definition
- Comparative line graphs
- Display multiple variables on the same axes, allowing direct comparison, like birth and death rates in the Demographic Transition Model.
- Compound line graphs
- Stack variables to show both the total and the proportional breakdown of components, such as total energy generation divided into coal, gas, and renewables.
- Divergent line graphs
- Plot values above and below a zero line or average, effectively illustrating positive and negative changes, such as net migration or temperature anomalies.
- Simple line graphs
- Plot a single variable, such as annual rainfall.
Label the diagram
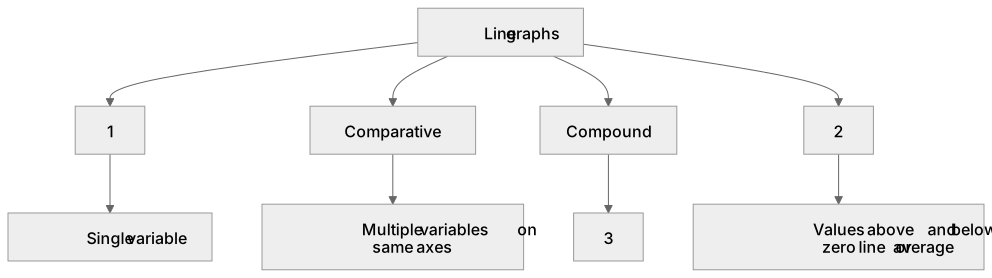
Some boxes have lost their names. Pick the right name for each number.
1Box 1
2Box 2
3Box 3
There is more to this lesson
The full lesson goes on to check your understanding and help you earn the marks. Create a free account to carry on, with your progress saved.
A week of Premium from your first lesson · Then the free plan continues · No card, no charge
Test your understanding of Graphical skills: Line graphs – simple, comparative, compound and divergent.
Active recall beats re-reading. Take an instant quiz now to test what you’ve learned and lock it into long-term memory.
A week of Premium from your first lesson · Then the free plan continues · No card, no charge