AQA · A-Level · Geography
Course version: 7037 · Version from Sept 2018
Graphical skills: Bar graphs – simple, comparative, compound and divergent.
Bar graphs display discrete or categorical data using rectangular bars where length is proportional to value.
Checked against the AQA 7037 specification (opens in a new tab) on .
- Point 2 of 7
- 4 key terms
Study notes
From the checked teaching notes for this specification point.
The idea
Bar graphs display discrete or categorical data using rectangular bars where length is proportional to value. Simple bar graphs show a single variable, such as total rainfall per month. Comparative (or multiple) bar graphs place bars side-by-side to compare categories across groups, like comparing male and female populations across different cities. Compound (or stacked) bar graphs divide a single bar into segments representing sub-categories, illustrating both the total and its composition, such as total energy generation split by coal, gas, and renewables. Divergent bar graphs display values extending in opposite directions from a central zero axis, which is highly effective for showing positive and negative changes, such as net migration rates or percentage population growth and decline across various regions.
What earns the marks
- Accurately plotting data points using an appropriate scale and axis labels.
- Selecting the correct type of bar graph (simple, comparative, compound, divergent) for the provided dataset.
- Interpreting the composition of compound bars by calculating the difference between segment boundaries.
- Identifying trends, anomalies, or comparisons from comparative and divergent bar graphs.
Common mistakes and how to put them right
Reading the top value of a stacked segment as its absolute value.
Put it right: Subtract the bottom value of the segment from the top value to find the true segment value.
Drawing bars with unequal widths or inconsistent spacing.
Put it right: Ensure all bars are of equal width and the gaps between discrete categories are uniform.
Failing to include a key or legend for comparative and compound graphs.
Put it right: Provide a clear key that identifies the shading or colour used for each sub-category.
Exam tips
- When analysing a divergent bar graph, explicitly state whether the values represent positive or negative trends and quote data from both sides of the zero line.
- Use a ruler to read across from the top of a bar to the y-axis to ensure accurate data extraction, especially on compound graphs.
- If asked to complete a graph, check the existing scale carefully to ensure your plotted bar aligns exactly with the established intervals.
Try the lesson
The start of the Graphical skills: Bar graphs – simple, comparative, compound and divergent. lesson, made from checked teaching notes for this specification point.
Have a go first
A geographer wants to display the total population of four different cities. For each city, they want to show the population subdivided into three age categories (under 18, 18-65, and over 65) within a single column. Which type of bar graph is most appropriate for this data?
Listen
Bar graphs display discrete or categorical data using rectangular bars where length is proportional to value. Simple bar graphs show a single variable, such as total rainfall per month. Comparative (or multiple) bar graphs place bars side-by-side to compare categories across groups, like comparing male and female populations across different cities. Compound (or stacked) bar graphs divide a single bar into segments representing sub-categories, illustrating both the total and its composition, such as total energy generation split by coal, gas, and renewables. Divergent bar graphs display values extending in opposite directions from a central zero axis, which is highly effective for showing positive and negative changes, such as net migration rates or percentage population growth and decline across various regions. A strong answer earns marks for these points. Accurately plotting data points using an appropriate scale and axis labels. Selecting the correct type of bar graph (simple, comparative, compound, divergent) for the provided dataset. Interpreting the composition of compound bars by calculating the difference between segment boundaries. Identifying trends, anomalies, or comparisons from comparative and divergent bar graphs. A common slip: Reading the top value of a stacked segment as its absolute value. Instead, Subtract the bottom value of the segment from the top value to find the true segment value. Exam tip: When analysing a divergent bar graph, explicitly state whether the values represent positive or negative trends and quote data from both sides of the zero line.
See it
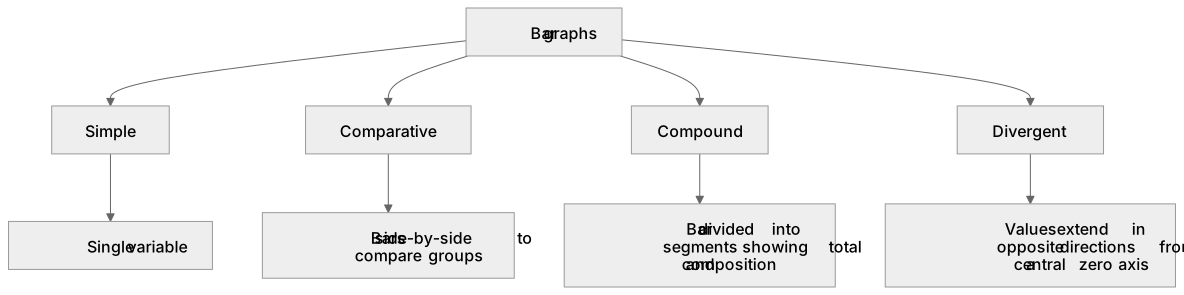
Key words
Say what each word means before you turn the card.
Simple bar graph
Try answering aloud or in your head before turning the card.
Comparative bar graph
Try answering aloud or in your head before turning the card.
Compound bar graph
Try answering aloud or in your head before turning the card.
Divergent bar graph
Try answering aloud or in your head before turning the card.
See every definition
- Simple bar graph
- A graph showing a single variable using rectangular bars whose length is proportional to value.
- Comparative bar graph
- Bars placed side-by-side to compare categories across groups, such as populations across different cities.
- Compound bar graph
- A single bar divided into segments representing sub-categories, illustrating both the total and its composition.
- Divergent bar graph
- Values extending in opposite directions from a central zero axis, effective for showing positive and negative changes.
Label the diagram
Some boxes have lost their names. Pick the right name for each number.
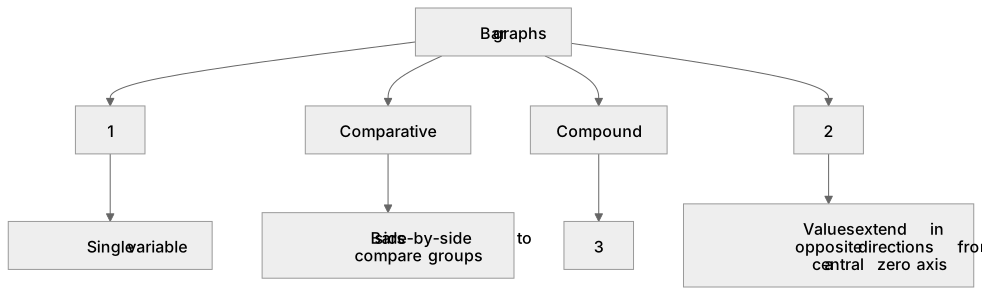
1Box 1
2Box 2
3Box 3
There is more to this lesson
The full lesson goes on to check your understanding and help you earn the marks. Create a free account to carry on, with your progress saved.
A week of Premium from your first lesson · Then the free plan continues · No card, no charge
Test your understanding of Graphical skills: Bar graphs – simple, comparative, compound and divergent.
Active recall beats re-reading. Take an instant quiz now to test what you’ve learned and lock it into long-term memory.
A week of Premium from your first lesson · Then the free plan continues · No card, no charge