AQA · A-Level · Geography
Course version: 7037 · Version from Sept 2018
Understanding of the purposes and difference between the following and to…
Full specification wording
Qualitative skills and quantitative skills: understanding of the purposes and difference between the following and to use them in appropriate contexts: descriptive statistics of central tendency and dispersion; descriptive measures of difference and association, inferential statistics and the foundations of relational statistics; measurement, measurement errors, and sampling; understanding of the ethical and socio-political implications of collecting, studying and representing geographical data about human communities.
Select statistics for the question, variables and data type.
Checked against the AQA 7037 specification (opens in a new tab) on .
- Point 6 of 6
- 4 key terms
Study notes
From the checked teaching notes for this specification point.
The idea
Select statistics for the question, variables and data type. Central tendency describes a typical value and dispersion describes spread. Descriptive measures of difference compare sample groups; measures of association describe a relationship's direction and strength. Neither alone supports inference to a wider population. Inferential statistics use sample evidence, a null hypothesis and a significance threshold to judge whether a pattern is unlikely under chance. Relational foundations include identifying variables, interpreting strength and direction and recognising that correlation does not prove causation. Keep measurement error separate from sampling error: calibration, repeated readings and standard procedures address measurement error; sampling design and adequate samples address bias and uncertainty. Human data requires consent, privacy, secure handling and fair representation.
What earns the marks
- Distinguish central tendency from dispersion and choose measures suited to the distribution and data scale.
- Use descriptive measures of difference or association to characterise sample patterns without claiming population-level significance.
- Explain how inferential reasoning uses variables, a null hypothesis and a significance threshold to test a relationship or difference, while correlation does not establish causation.
- Distinguish measurement error from sampling error or bias, and match calibration, repeat measurement, standardised procedures and sampling design to the correct problem.
- Evaluate ethical and socio-political implications including informed consent, privacy, data security, imposed categories, power and fair representation of communities.
Common mistakes and how to put them right
Using the mean for highly skewed data.
Put it right: Consider the median and report dispersion so extreme values do not distort the summary.
Treating a descriptive difference or association as proof about a wider population.
Put it right: Distinguish sample description from inferential significance testing and interpret the null hypothesis.
Claiming random or stratified sampling reduces measurement error.
Put it right: Sampling design addresses selection bias and sampling uncertainty, while calibrated instruments, repeats and standard procedures address measurement error.
Interpreting correlation as causation.
Put it right: Consider confounding variables, direction of influence and the limits of an observational relationship.
Treating ethics as consent alone.
Put it right: Also consider anonymity, data protection, power, category choice and how conclusions represent a community.
Exam tips
- Name the data type, variables and investigation aim before justifying a descriptive measure or significance test.
- State separately how you controlled measurement error and how your sampling design addressed bias and sampling uncertainty.
- When interpreting a relationship, report direction and strength, explain the significance decision, and avoid claiming causation without supporting evidence.
- For human data, connect ethical and socio-political safeguards to the actual participants, categories and representations in the enquiry.
Try the lesson
The start of the Qualitative skills and quantitative skills: understanding of the purposes and difference between the following and to use them in appropriate contexts: descriptive statistics of central tendency and dispersion; descriptive measures of difference and association, inferential statistics and the foundations of relational statistics; measurement, measurement errors, and sampling; understanding of the ethical and socio-political implications of collecting, studying and representing geographical data about human communities. lesson, made from checked teaching notes for this specification point.
Have a go first
Which of the following statistical measures is used to describe the dispersion or spread of a set of geographical data?
Listen
Select statistics for the question, variables and data type. Central tendency describes a typical value and dispersion describes spread. Descriptive measures of difference compare sample groups; measures of association describe a relationship's direction and strength. Neither alone supports inference to a wider population. Inferential statistics use sample evidence, a null hypothesis and a significance threshold to judge whether a pattern is unlikely under chance. Relational foundations include identifying variables, interpreting strength and direction and recognising that correlation does not prove causation. Keep measurement error separate from sampling error: calibration, repeated readings and standard procedures address measurement error; sampling design and adequate samples address bias and uncertainty. Human data requires consent, privacy, secure handling and fair representation. A strong answer earns marks for these points. Distinguish central tendency from dispersion and choose measures suited to the distribution and data scale. Use descriptive measures of difference or association to characterise sample patterns without claiming population-level significance. Explain how inferential reasoning uses variables, a null hypothesis and a significance threshold to test a relationship or difference, while correlation does not establish causation. Distinguish measurement error from sampling error or bias, and match calibration, repeat measurement, standardised procedures and sampling design to the correct problem. A common slip: Using the mean for highly skewed data. Instead, consider the median and report dispersion so extreme values do not distort the summary. Exam tip: Name the data type, variables and investigation aim before justifying a descriptive measure or significance test.
See it
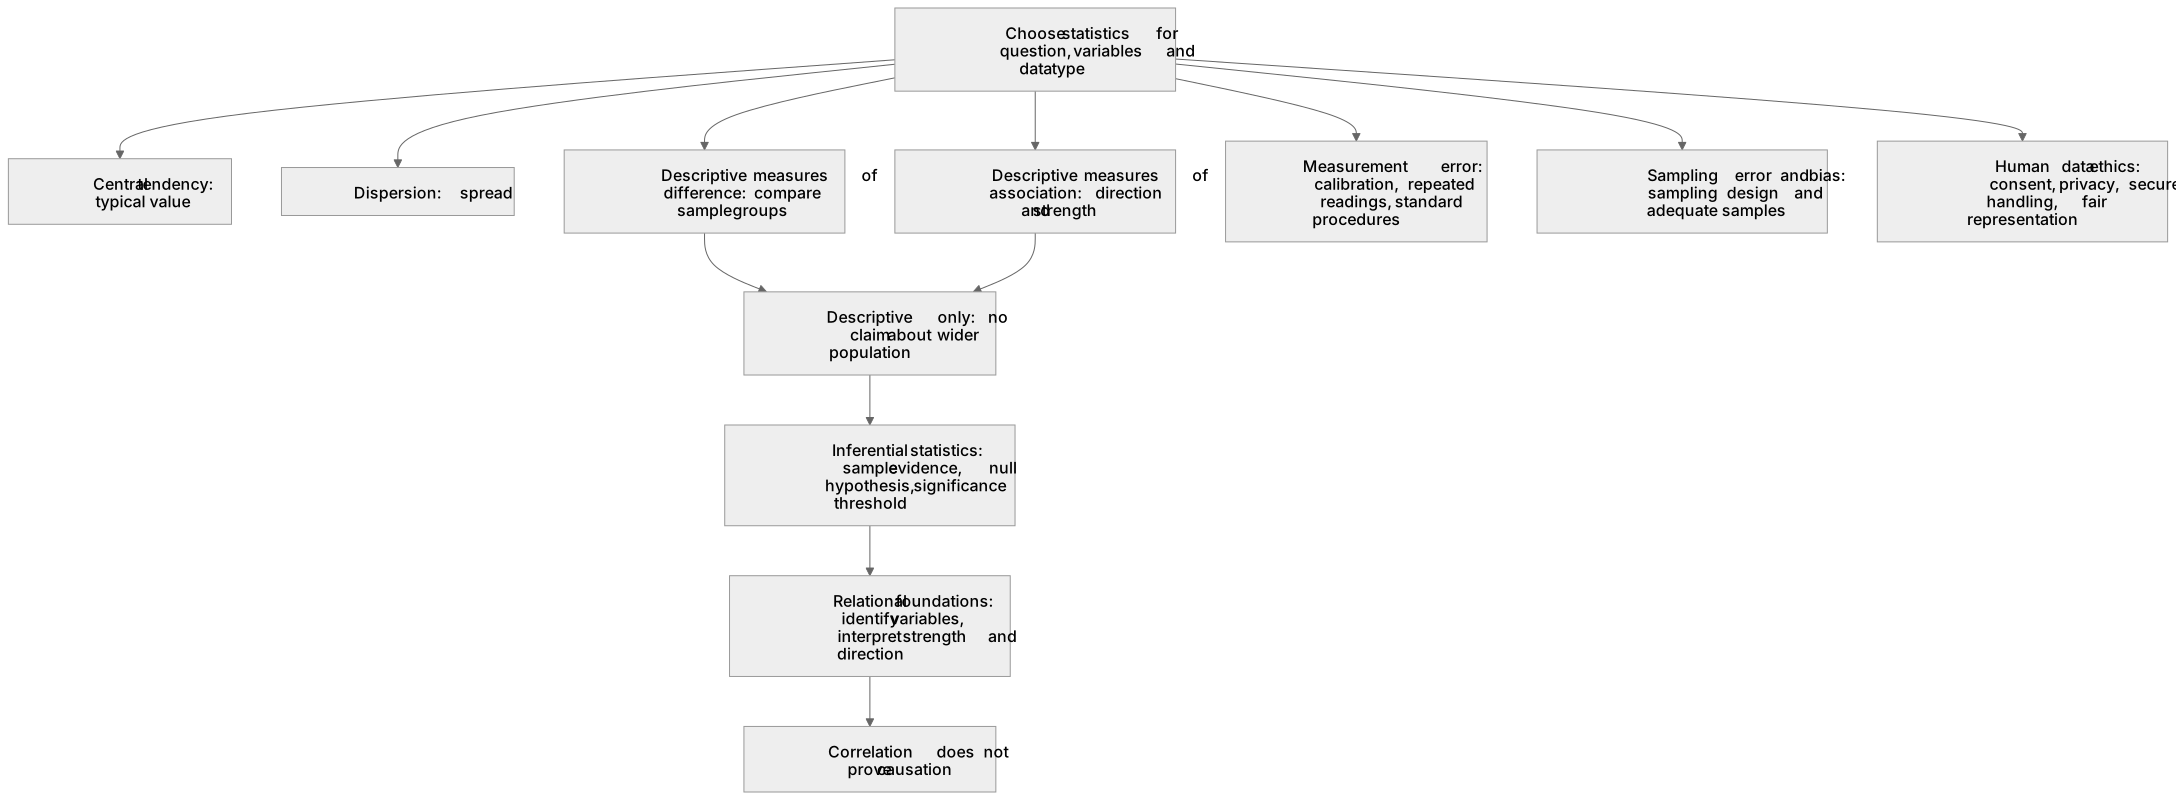
Key words
Say what each word means before you turn the card.
Central tendency
Try answering aloud or in your head before turning the card.
Dispersion
Try answering aloud or in your head before turning the card.
Inferential statistics
Try answering aloud or in your head before turning the card.
Measurement error
Try answering aloud or in your head before turning the card.
See every definition
- Central tendency
- A descriptive statistic that describes a typical value, chosen to suit the distribution and data scale.
- Dispersion
- A descriptive statistic that describes spread, reported so extreme values do not distort the summary.
- Inferential statistics
- Use sample evidence, a null hypothesis and a significance threshold to judge whether a pattern is unlikely under chance.
- Measurement error
- Addressed by calibration, repeated readings and standard procedures, and kept separate from sampling error.
Label the diagram
Some boxes have lost their names. Pick the right name for each number.
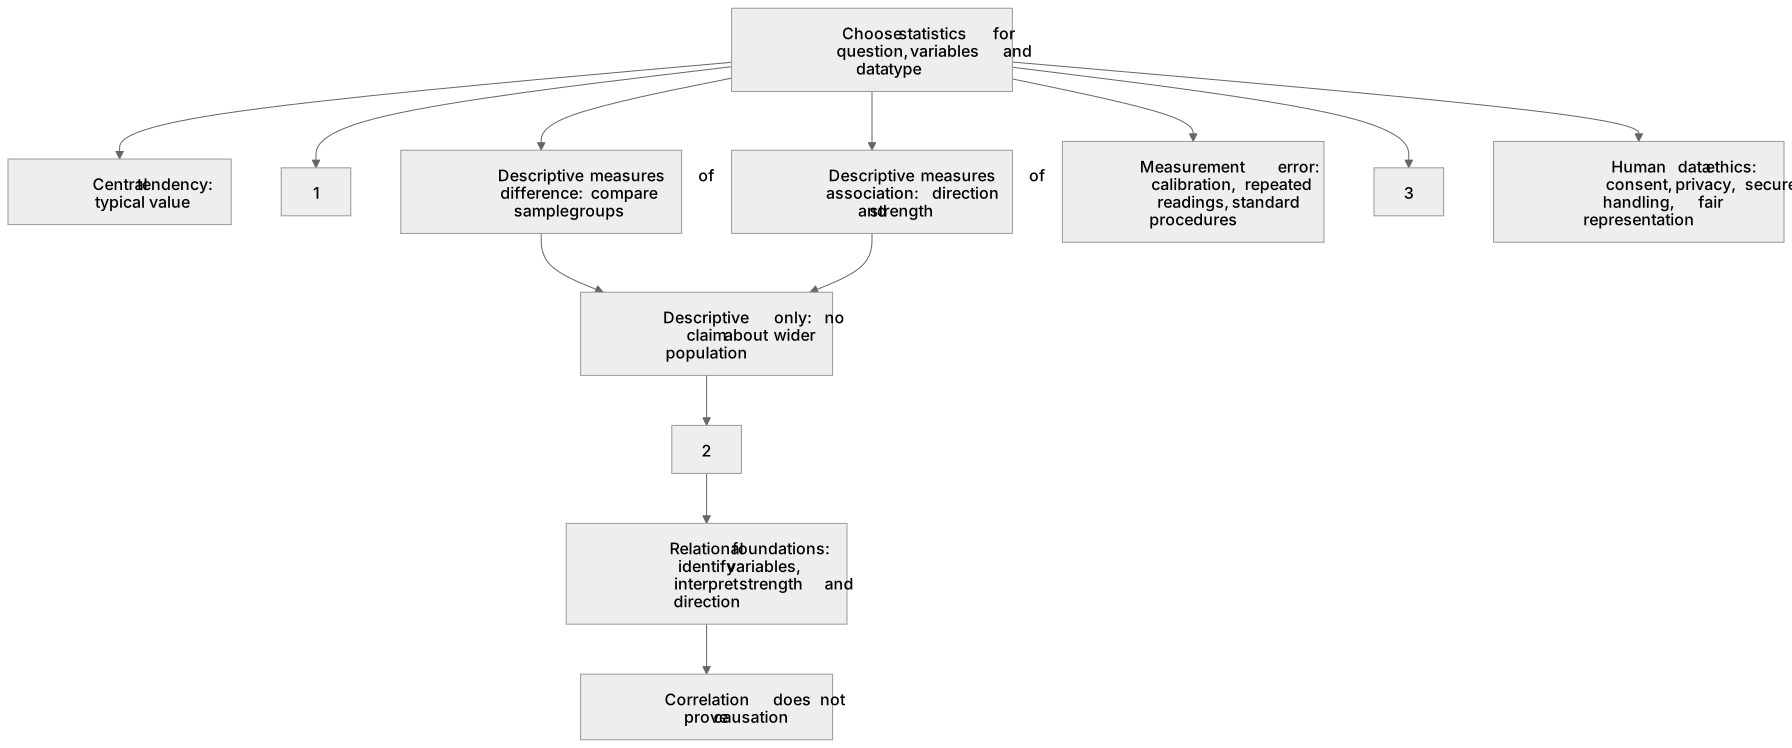
1Box 1
2Box 2
3Box 3
There is more to this lesson
The full lesson goes on to check your understanding and help you earn the marks. Create a free account to carry on, with your progress saved.
A week of Premium from your first lesson · Then the free plan continues · No card, no charge
Test your understanding of Qualitative skills and quantitative skills: understanding of the purposes and difference between the following and to use them in appropriate contexts: descriptive statistics of central tendency and dispersion; descriptive measures of difference and association, inferential statistics and the foundations of relational statistics; measurement, measurement errors, and sampling; understanding of the ethical and socio-political implications of collecting, studying and representing geographical data about human communities.
Active recall beats re-reading. Take an instant quiz now to test what you’ve learned and lock it into long-term memory.
A week of Premium from your first lesson · Then the free plan continues · No card, no charge