AQA · A-Level · Geography
Course version: 7037 · Version from Sept 2018
Understanding of what makes data geographical and the geospatial…
Full specification wording
Qualitative skills and quantitative skills: understanding of what makes data geographical and the geospatial technologies (eg GIS) that are used to collect, analyse and present geographical data
Data becomes 'geographical' when it possesses a spatial component, meaning it is tied to a specific location on the Earth's surface using coordinates like latitude and longitude.
Checked against the AQA 7037 specification (opens in a new tab) on .
- Point 4 of 6
- 4 key terms
Study notes
From the checked teaching notes for this specification point.
The idea
Data becomes 'geographical' when it possesses a spatial component, meaning it is tied to a specific location on the Earth's surface using coordinates like latitude and longitude. Geospatial technologies, particularly Geographic Information Systems (GIS), are essential for handling this spatial data. GIS allows geographers to collect data via GPS or satellite imagery, analyse it by overlaying multiple thematic layers (such as flood risk zones and population density), and present the findings through interactive digital maps. By linking location data with attribute data (descriptive information about the location), geospatial technologies enable complex spatial analysis, revealing patterns and relationships that traditional databases cannot show.
What earns the marks
- Define geographical data as information that includes explicit spatial references, such as coordinates, postcodes, or grid references.
- Explain how geospatial technologies like GIS collect data using remote sensing, GPS, and digital field surveys.
- Describe the analytical capabilities of GIS, such as buffering, querying, and overlaying multiple data layers to identify spatial relationships.
- Evaluate the use of GIS in presenting geographical data, noting its ability to create dynamic, easily updatable, and highly visual cartographic outputs.
Common mistakes and how to put them right
Treating GIS merely as a map-making tool.
Put it right: GIS is fundamentally an analytical database that links spatial and attribute data, not just a drawing program.
Failing to distinguish between spatial data (the location) and attribute data (the characteristics of that location).
Put it right: Both are required for GIS to function effectively.
Using vague terms like 'computers' instead of specifying geospatial technologies like GIS, GPS, or remote sensing when discussing data collection and analysis.
Exam tips
- When asked how to improve a methodology, suggest using GIS to overlay different variables to analyse spatial correlations.
- Clearly state that geographical data must have a locational element; use examples like eastings and northings to demonstrate this understanding.
- Highlight the dynamic nature of GIS presentations, such as the ability to toggle layers on and off, compared to static paper maps.
Try the lesson
The start of the Qualitative skills and quantitative skills: understanding of what makes data geographical and the geospatial technologies (eg GIS) that are used to collect, analyse and present geographical data lesson, made from checked teaching notes for this specification point.
Have a go first
Which of the following characteristics is the defining feature that makes a dataset 'geographical'?
Listen
Data becomes 'geographical' when it possesses a spatial component, meaning it is tied to a specific location on the Earth's surface using coordinates like latitude and longitude. Geospatial technologies, particularly Geographic Information Systems (GIS), are essential for handling this spatial data. GIS allows geographers to collect data via GPS or satellite imagery, analyse it by overlaying multiple thematic layers (such as flood risk zones and population density), and present the findings through interactive digital maps. By linking location data with attribute data (descriptive information about the location), geospatial technologies enable complex spatial analysis, revealing patterns and relationships that traditional databases cannot show. A strong answer earns marks for these points. Define geographical data as information that includes explicit spatial references, such as coordinates, postcodes, or grid references. Explain how geospatial technologies like GIS collect data using remote sensing, GPS, and digital field surveys. Describe the analytical capabilities of GIS, such as buffering, querying, and overlaying multiple data layers to identify spatial relationships. Evaluate the use of GIS in presenting geographical data, noting its ability to create dynamic, easily updatable, and highly visual cartographic outputs. Exam tip: When asked how to improve a methodology, suggest using GIS to overlay different variables to analyse spatial correlations.
See it
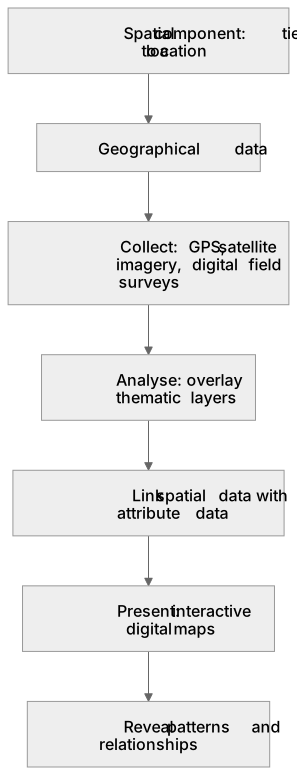
Put it in order
Put these steps in the order they happen.
- 1. Reveal patterns and relationships
- 2. Present: interactive digital maps
- 3. Collect: GPS, satellite imagery, digital field surveys
- 4. Link spatial data with attribute data
- 5. Spatial component: tied to a location
- 6. Geographical data
- 7. Analyse: overlay thematic layers
Key words
Say what each word means before you turn the card.
Spatial and attribute data
Try answering aloud or in your head before turning the card.
Geospatial technologies
Try answering aloud or in your head before turning the card.
Data overlay and analysis
Try answering aloud or in your head before turning the card.
Digital cartography
Try answering aloud or in your head before turning the card.
See every definition
- Spatial and attribute data
- Spatial data is the location, while attribute data is the descriptive information about that location, and both are required for GIS to function effectively.
- Geospatial technologies
- Technologies such as GIS, GPS and remote sensing that are used to collect, analyse and present geographical data.
- Data overlay and analysis
- Overlaying multiple thematic layers, such as flood risk zones and population density, to reveal patterns and relationships that traditional databases cannot show.
- Digital cartography
- Presenting findings through interactive digital maps that are dynamic, easily updatable and highly visual, with layers that can be toggled on and off.
Label the diagram
Some boxes have lost their names. Pick the right name for each number.
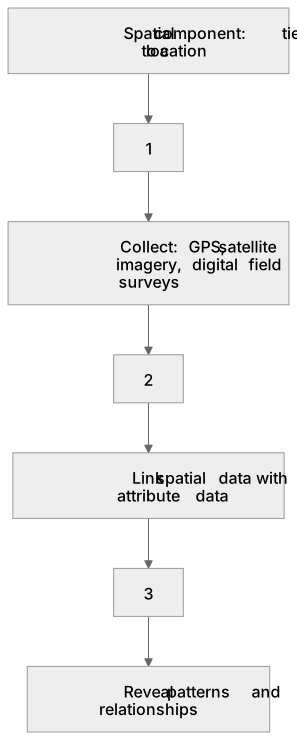
1Box 1
2Box 2
3Box 3
There is more to this lesson
The full lesson goes on to check your understanding and help you earn the marks. Create a free account to carry on, with your progress saved.
A week of Premium from your first lesson · Then the free plan continues · No card, no charge
Test your understanding of Qualitative skills and quantitative skills: understanding of what makes data geographical and the geospatial technologies (eg GIS) that are used to collect, analyse and present geographical data
Active recall beats re-reading. Take an instant quiz now to test what you’ve learned and lock it into long-term memory.
A week of Premium from your first lesson · Then the free plan continues · No card, no charge