AQA · GCSE · Mathematics
Course version: 8300 · Version from Sept 2015
Record, describe and analyse the frequency of outcomes of probability…
Full specification wording
Probability: record, describe and analyse the frequency of outcomes of probability experiments using tables and frequency trees
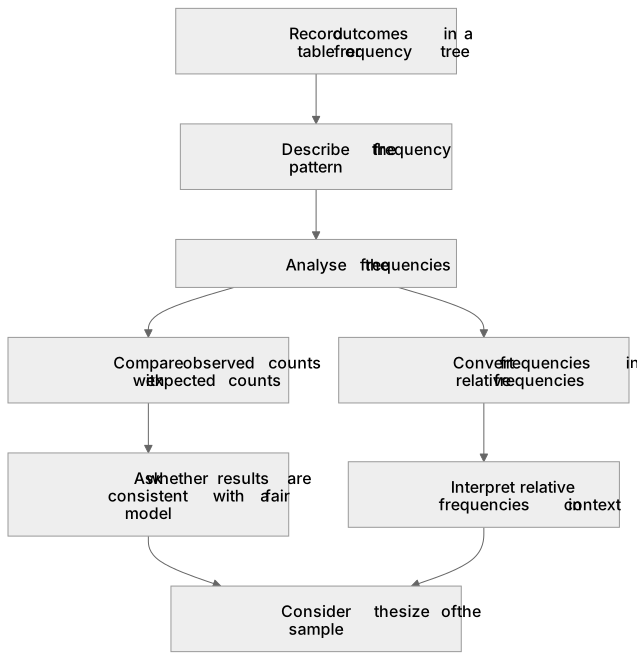
This skill has three linked stages.
Checked against the AQA 8300 specification (opens in a new tab) on .
- Point 1 of 10
- 4 key terms
Study notes
From the checked teaching notes for this specification point.
The idea
This skill has three linked stages. First, record outcomes from a probability experiment in a structured table, tallying each result as it occurs. Second, describe the pattern you see, for example that a fair coin landed heads more often in a small number of trials. Third, analyse the frequencies by comparing them with theoretical expectations and by converting them into relative frequencies. A frequency tree organises the same information across successive stages: each branch records a count, and the branch counts at each stage must sum to the total entering that stage. For example, if 80 students are surveyed and 30 walk, the remaining 50 use another method, so the two branch counts sum to 80. Analysis means asking whether results are consistent with a fair model, not merely reading numbers off the table.
What earns the marks
- Records each outcome accurately in a tally or frequency table, with a clearly labelled outcome column and a running total.
- Constructs a frequency tree in which the counts on branches from the same point sum to the total entering that point.
- Describes the observed frequencies in words, identifying the most and least common outcomes and the overall pattern.
- Analyses frequencies by comparing observed counts with expected counts for a fair or equally likely model.
- Converts frequencies into relative frequencies or proportions, for example 18 out of 60 gives 0.3, and interprets them in context.
- Recognises that small samples can show large apparent deviations from expectation purely by chance.
Common mistakes and how to put them right
Recording outcomes without a clear tally or total, so the frequencies cannot be checked.
Put it right: Keep a running total and verify that all outcome frequencies sum to the number of trials.
Building a frequency tree whose branch counts do not sum to the total entering that stage.
Put it right: Check each pair or group of branches adds to the incoming total before moving on.
Treating the observed relative frequency from a small experiment as the exact probability.
Put it right: Describe it as an estimate that tends to become more stable as the number of trials increases.
Comparing raw counts from experiments with different numbers of trials.
Put it right: Compare relative frequencies or proportions instead.
Exam tips
- Label every row and column of a frequency table, including the outcome and the frequency, and show the total so the examiner can follow your recording.
- When drawing a frequency tree, write the count on each branch and check at every stage that the branches sum to the total entering that stage.
- If asked to analyse, go beyond describing the numbers: state what the frequencies suggest about fairness or randomness and refer to the size of the sample.
Try the lesson
The start of the Probability: record, describe and analyse the frequency of outcomes of probability experiments using tables and frequency trees lesson, made from checked teaching notes for this specification point.
Have a go first
A frequency tree shows the outcomes of 80 spins of a spinner. The first branch splits into 'Red' and 'Not Red'. The 'Red' branch has a frequency of 35. The 'Not Red' branch splits into 'Blue' and 'Green'. If the frequency of 'Blue' is 20, what is the frequency of 'Green'?
Listen
This skill has three linked stages. First, record outcomes from a probability experiment in a structured table, tallying each result as it occurs. Second, describe the pattern you see, for example that a fair coin landed heads more often in a small number of trials. Third, analyse the frequencies by comparing them with theoretical expectations and by converting them into relative frequencies. A frequency tree organises the same information across successive stages: each branch records a count, and the branch counts at each stage must sum to the total entering that stage. For example, if 80 students are surveyed and 30 walk, the remaining 50 use another method, so the two branch counts sum to 80. Analysis means asking whether results are consistent with a fair model, not merely reading numbers off the table. A strong answer earns marks for these points. Records each outcome accurately in a tally or frequency table, with a clearly labelled outcome column and a running total. Constructs a frequency tree in which the counts on branches from the same point sum to the total entering that point. Describes the observed frequencies in words, identifying the most and least common outcomes and the overall pattern. Analyses frequencies by comparing observed counts with expected counts for a fair or equally likely model. A common slip: Recording outcomes without a clear tally or total, so the frequencies cannot be checked. Instead, keep a running total and verify that all outcome frequencies sum to the number of trials. Exam tip: Label every row and column of a frequency table, including the outcome and the frequency, and show the total so the examiner can follow your recording.
See it
Key words
Say what each word means before you turn the card.
frequency table
Try answering aloud or in your head before turning the card.
frequency tree
Try answering aloud or in your head before turning the card.
relative frequency
Try answering aloud or in your head before turning the card.
analysis
Try answering aloud or in your head before turning the card.
See every definition
- frequency table
- A structured table in which each outcome is recorded and tallied as it occurs, with a clearly labelled outcome column and a running total.
- frequency tree
- An organisational tool that records the same information across successive stages, where each branch records a count and the branch counts at each stage sum to the total entering that stage.
- relative frequency
- A frequency converted into a proportion, for example 18 out of 60 gives 0.3, interpreted in context as an estimate of probability.
- analysis
- Asking whether results are consistent with a fair model by comparing observed counts with expected counts, not merely reading numbers off the table.
Label the diagram
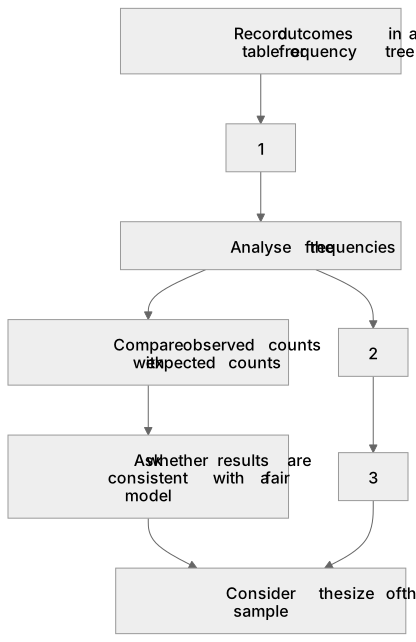
Some boxes have lost their names. Pick the right name for each number.
1Box 1
2Box 2
3Box 3
There is more to this lesson
The full lesson goes on to check your understanding and help you earn the marks. Create a free account to carry on, with your progress saved.
A week of Premium from your first lesson · Then the free plan continues · No card, no charge
Test your understanding of Probability: record, describe and analyse the frequency of outcomes of probability experiments using tables and frequency trees
Active recall beats re-reading. Take an instant quiz now to test what you’ve learned and lock it into long-term memory.
A week of Premium from your first lesson · Then the free plan continues · No card, no charge