AQA · GCSE · Mathematics
Course version: 8300 · Version from Sept 2015
Use scale factors, scale diagrams and maps
Full specification wording
Ratio, proportion and rates of change: use scale factors, scale diagrams and maps
A tiny map can represent an entire town, but only if you control the scale and the units. Master map-to-real and real-to-map calculations, accurate scale drawings and length factors, then practise showing the working that earns marks in AQA GCSE Mathematics.
- Point 3 of 21
- 13 min read
- 4 worked examples
- 7 practice questions
- 3 key terms
Study Notes
Overview
A map can fit an entire town onto one page because every real length is reduced by the same multiplier. In this topic, candidates learn to interpret that multiplier, calculate distances in both directions and create accurate scale drawings. The key is not remembering a trick: it is recognising a proportional relationship and keeping the units under control.
AQA GCSE Mathematics 8300 places this content in section 3.3, R2: use scale factors, scale diagrams and maps, including geometrical problems. It is assessed at both Foundation and Higher tiers. Questions can appear on the non-calculator paper or either calculator paper. 1 2
Typical tasks ask candidates to work out a real distance, find a drawing length, determine a missing scale or draw an object accurately. Multi-step questions may then use perimeter, area, bearings or speed. These connect ratio to geometry and everyday planning. A clear calculation can earn credit even when a later numerical step goes wrong, subject to the question's mark scheme. The worked examples below are original AQA-style practice, with illustrative rather than official mark allocations.
Key Concepts
1. Read the scale in the correct direction
A numerical map scale such as 1 : 25 000 normally means map length : real length, using the same unit on each side. Therefore, 1 cm on the map represents 25 000 cm in reality. Equally, 1 mm represents 25 000 mm. The ratio itself has no unit because like units cancel.
Convert the centimetres into a more useful real-world unit: 25 000 ÷ 100 = 250 m. Thus, the statement 1 cm represents 250 m describes exactly the same scale. Do not turn this mixed-unit statement into the numerical ratio 1 : 250. That would represent 1 cm to 250 cm, only 2.5 m.
A non-unitary scale works too. If 2 cm represents 500 m, divide both quantities by 2 to obtain 1 cm represents 250 m. To write a numerical ratio, first convert 500 m to 50 000 cm, then simplify 2 : 50 000 to 1 : 25 000.
Cover and recall: explain why the two numbers in a numerical scale ratio must use the same unit. Expected reasoning: the multiplier must compare lengths consistently, not compare centimetres with metres as if they were identical.
2. Convert units before numerical scaling
Know the length ladder: 10 mm = 1 cm; 100 cm = 1 m; 1000 m = 1 km. Consequently, 1 km = 100 000 cm. Move from a larger unit to a smaller unit by multiplying; move back by dividing.
For example, 2.75 km = 2750 m = 275 000 cm. Conversely, 160 000 cm = 1600 m = 1.6 km. Write at least one conversion line when it helps make your method visible.
There are two valid methods. With a numerical ratio 1 : n, use matching units before multiplying or dividing by n. Alternatively, rewrite the scale as a labelled conversion such as 1 cm represents 250 m, then calculate using that relationship. In the second method, the units differ deliberately and the conversion factor is 250 metres per map centimetre. Never mix the two methods halfway through.
Why does this work? Unit conversion changes how a length is written, not its physical size. A distance of 250 m is not bigger than 25 000 cm; those describe the same distance.
3. Move from map or diagram to reality
 Open full-size image (opens in a new tab)
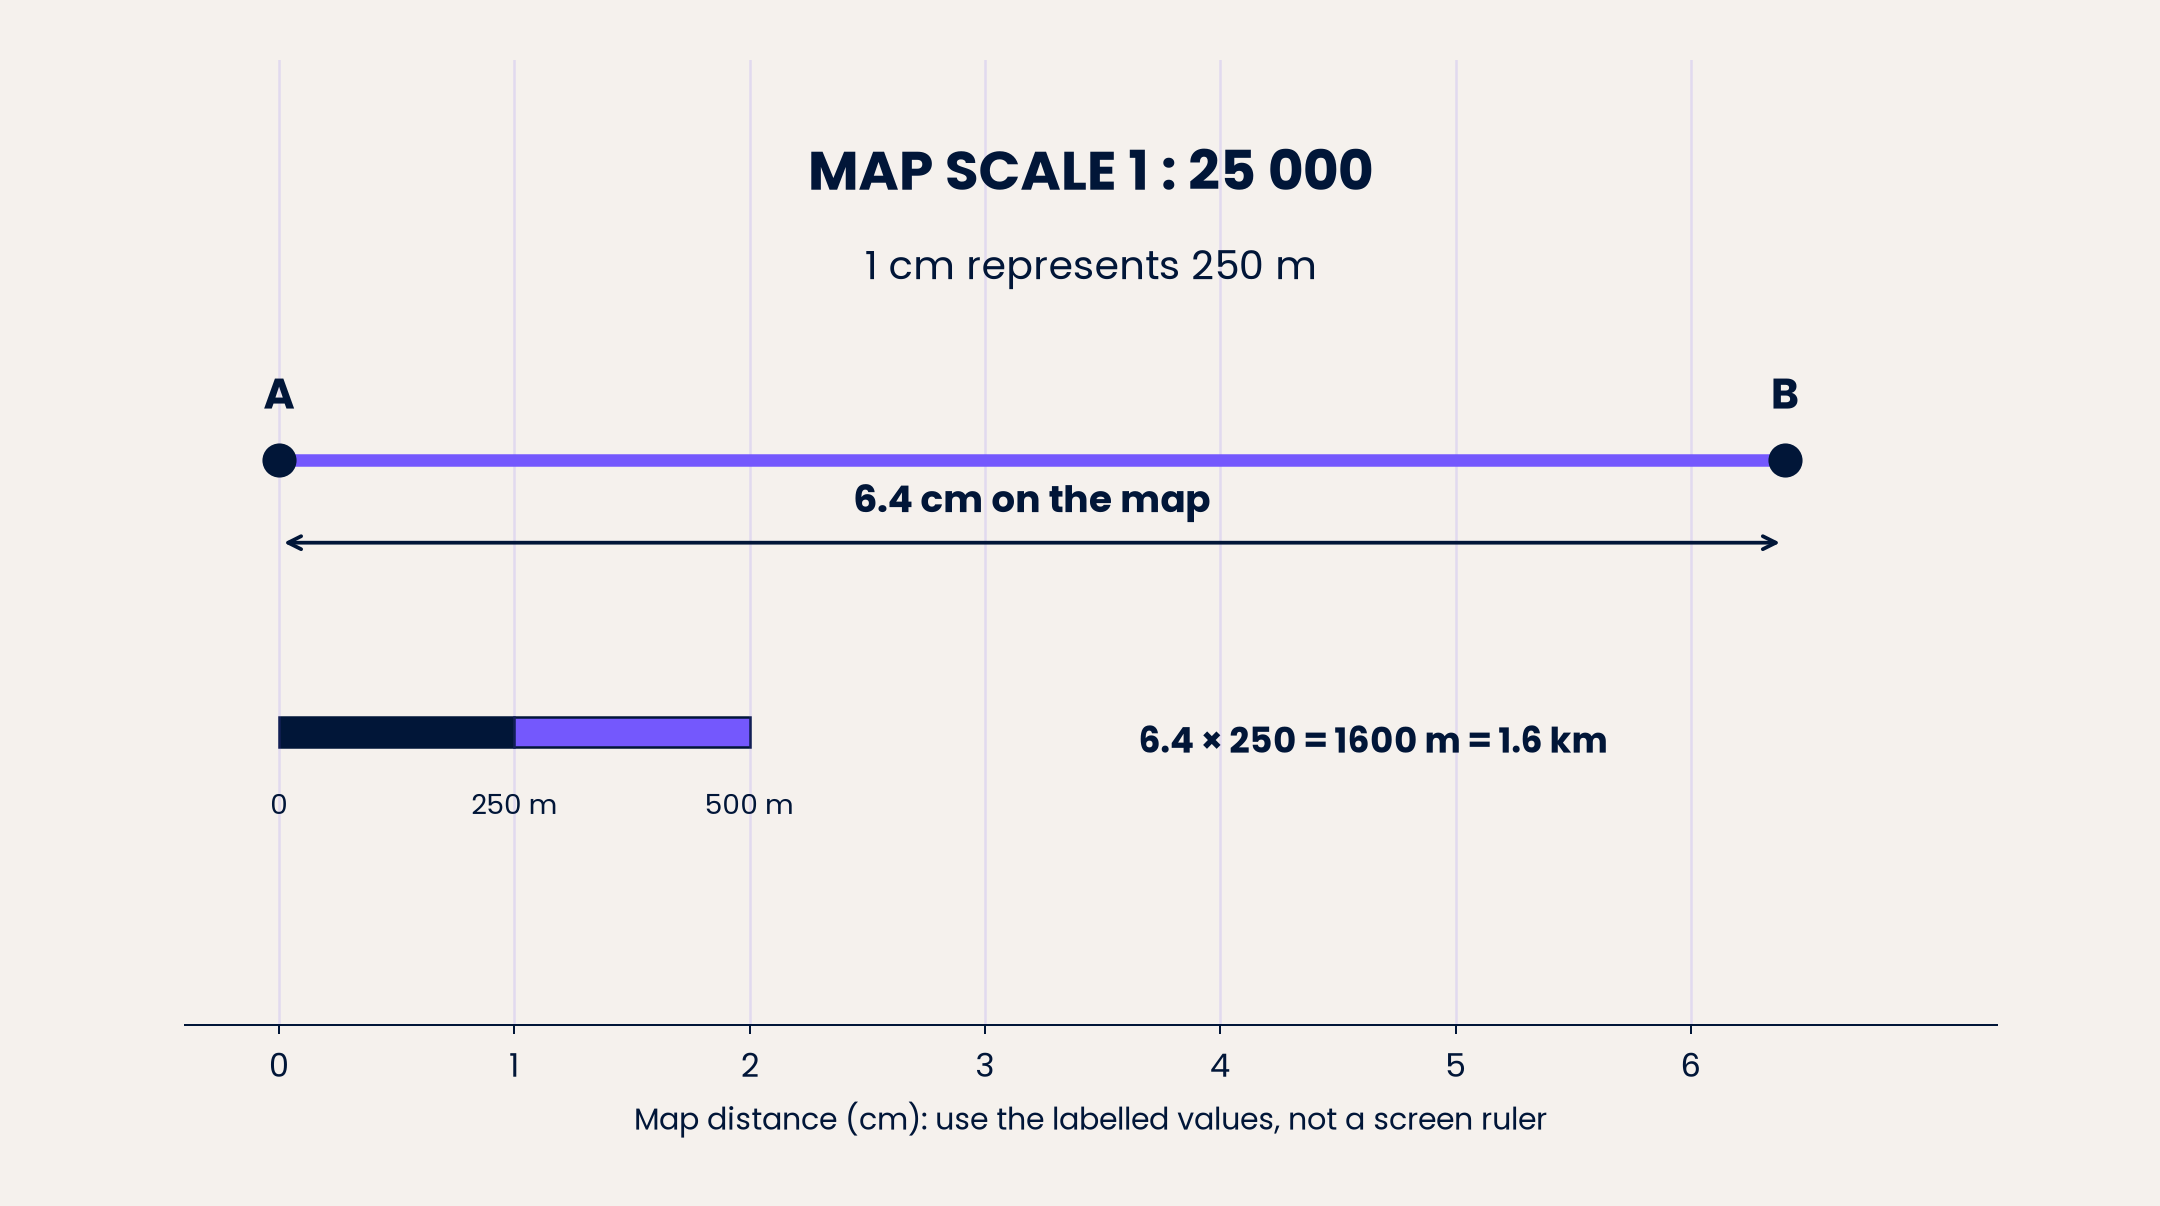
On a 1 : 25 000 map, A and B are 6.4 cm apart. Since each centimetre represents 250 m, calculate 6.4 × 250 = 1600 m = 1.6 km. The diagram's scale bar represents 500 m across two map centimetres, which gives the same relationship. Use its labels rather than measuring its displayed size.
Multiplication works because you are repeating the real distance represented by one map unit. For a quick non-calculator check, 6 × 250 = 1500 and 0.4 × 250 = 100. Add them to obtain 1600.
A statement such as 1 cm represents 4 m is equally straightforward. A wall drawn 3.5 cm long represents 3.5 × 4 = 14 m. Candidates should state the requested unit rather than leave a bare number.
A real distance should be numerically larger than the map distance when both are expressed in the same unit and the real object is larger. Do not compare the bare numbers 1.6 km and 6.4 cm to decide which physical length is larger.
4. Move from reality to the drawing
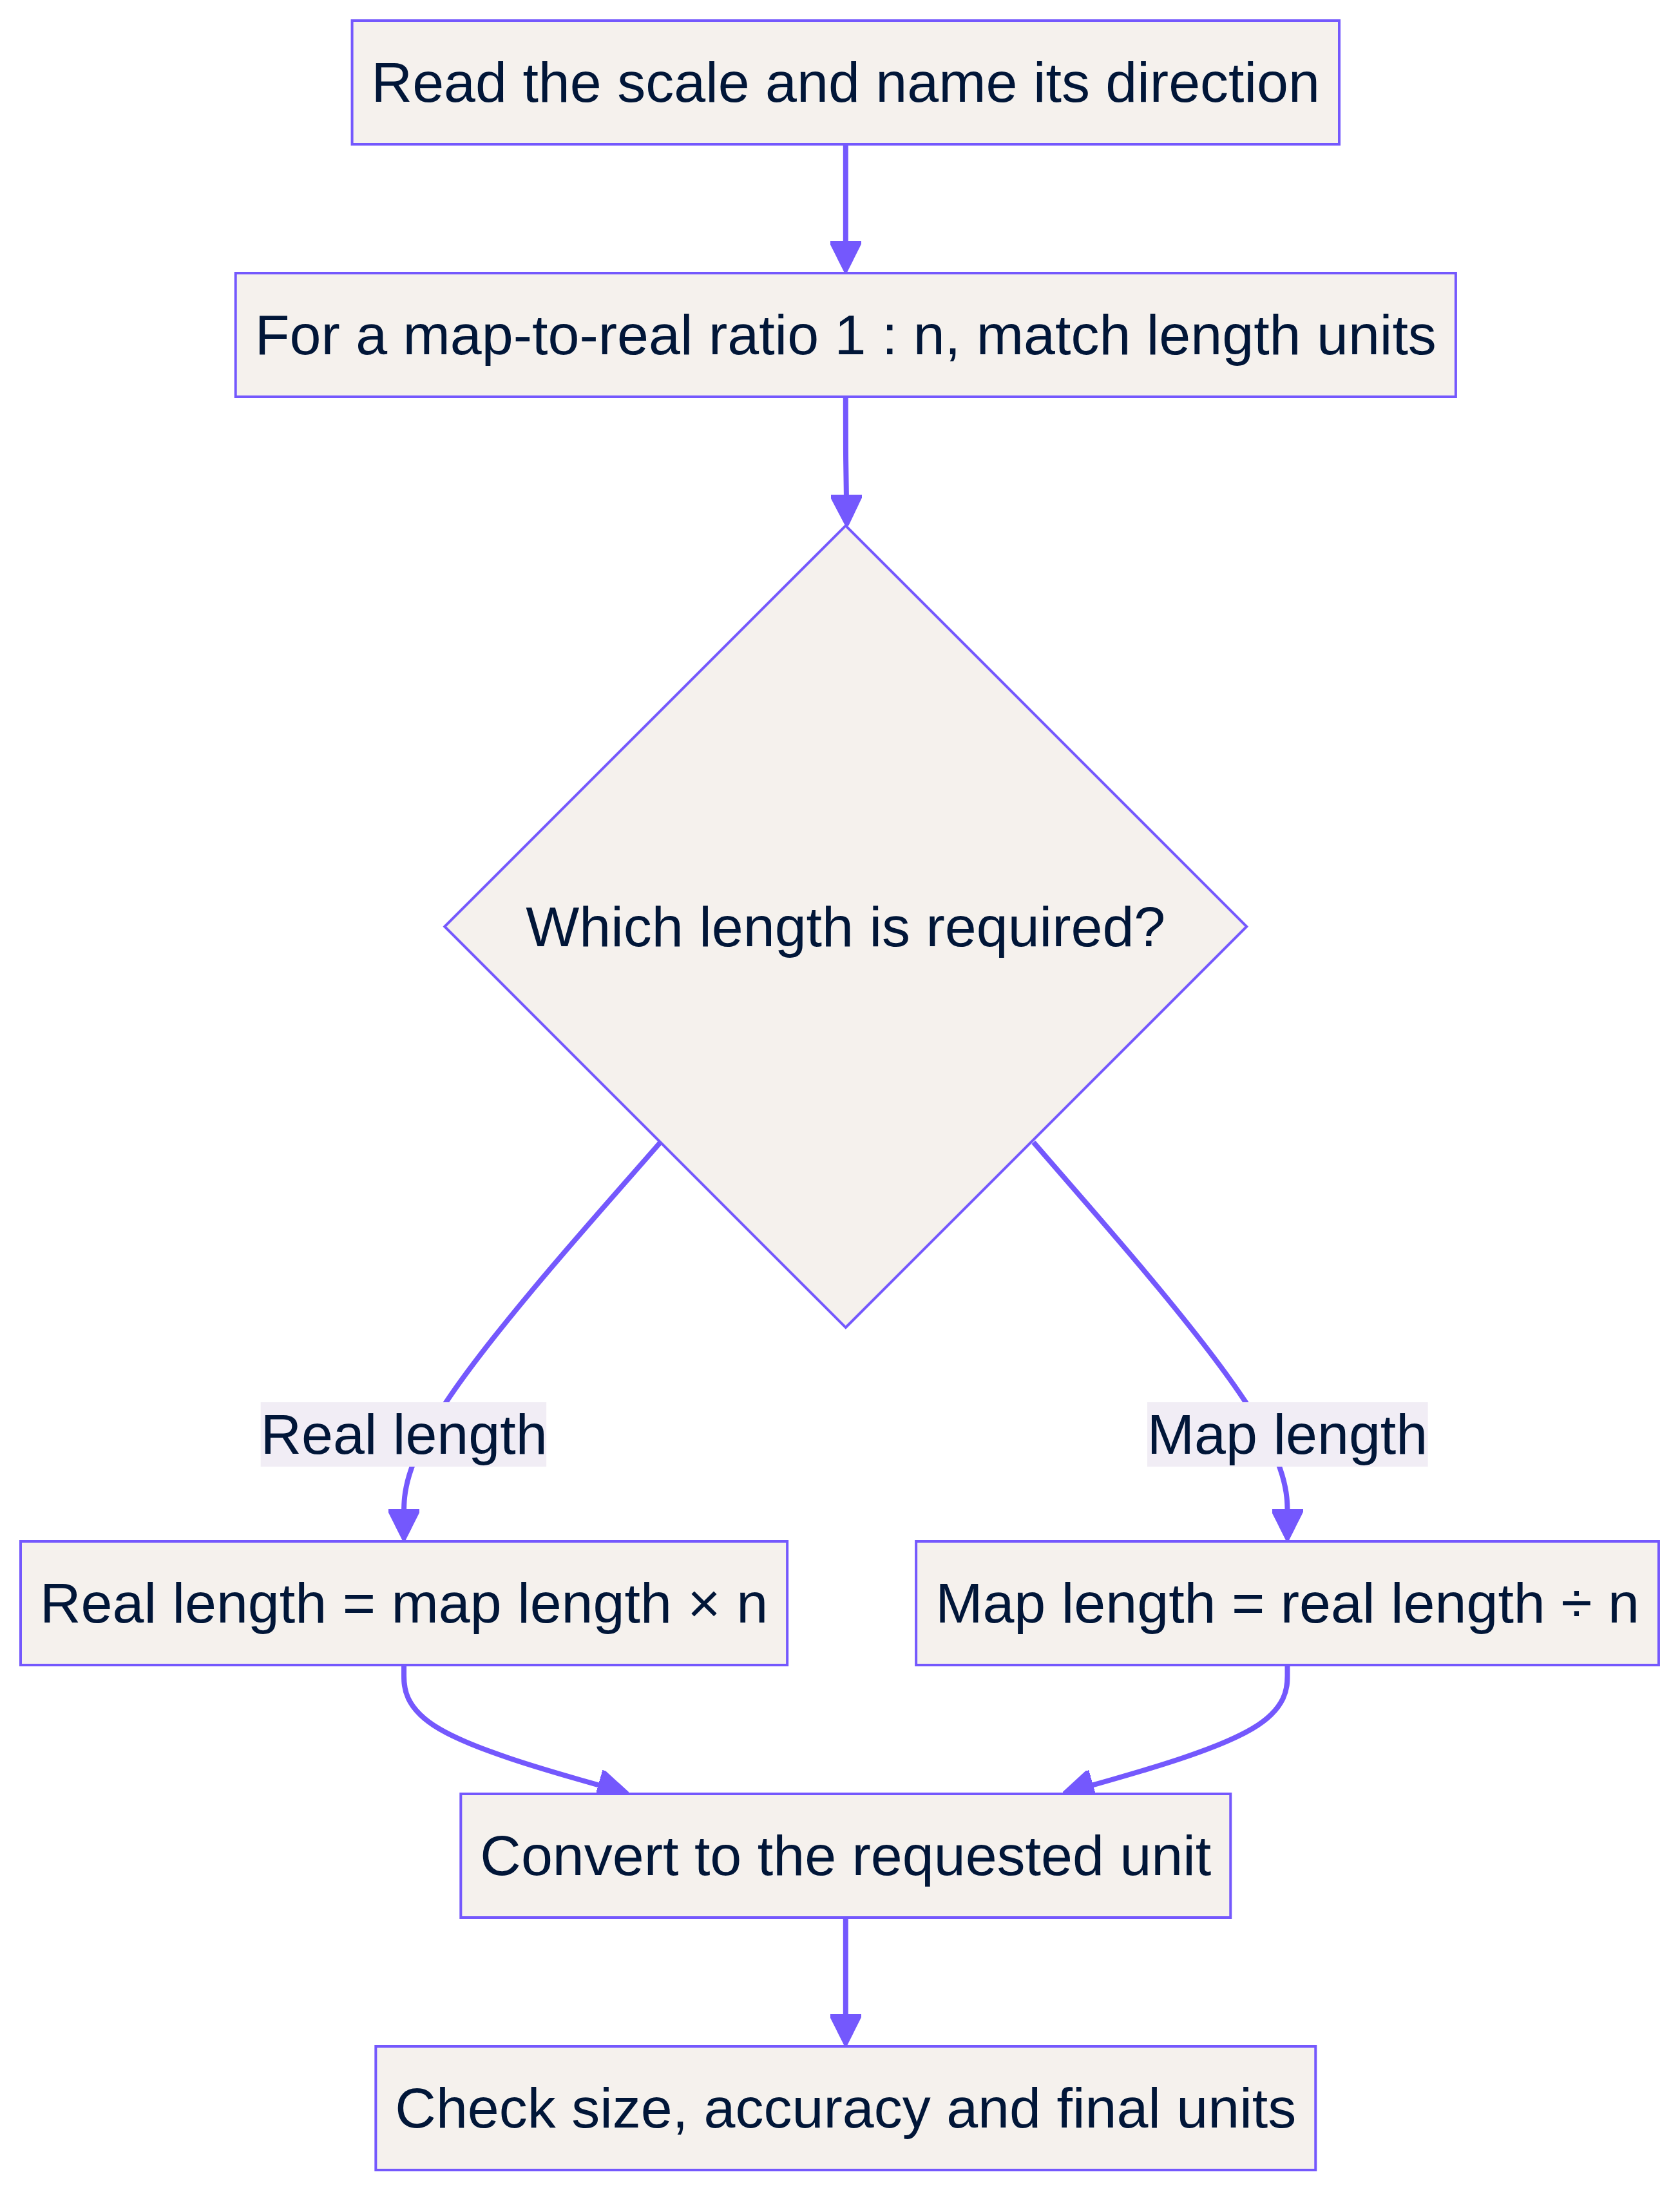
If a real path is 2.75 km long on a 1 : 25 000 map, convert to 2750 m. Divide by 250 m per map centimetre: 2750 ÷ 250 = 11 cm.
Division answers the question, “How many real-distance groups fit into the given length?” Since eleven groups of 250 m make 2750 m, eleven map centimetres are needed.
For a numerical-ratio method, use 275 000 cm ÷ 25 000 = 11 cm. Dividing 2.75 by 25 000 without first converting kilometres to the same unit would not produce a length in centimetres.
 Open full-size image (opens in a new tab)
Cover and recall: a real wall is 18 m long; 1 cm represents 3 m. Which operation is needed, and why? Divide 18 by 3 because each drawing centimetre accounts for 3 real metres. The drawing length is 6 cm.
5. Find a missing scale and compare scales
Suppose 3.2 cm on a plan represents 8 m. Convert 8 m to 800 cm. The drawing-to-real ratio is 3.2 : 800. Divide both sides by 3.2 to get 1 : 250. Alternatively, calculate the real length represented by 1 cm: 8 ÷ 3.2 = 2.5 m, equivalent to 250 cm.
For the same real object, a 1 : 100 drawing is larger than a 1 : 200 drawing. A 6 m wall becomes 6 cm on the first and 3 cm on the second. The larger denominator produces a smaller drawing because the drawing length is the real length divided by that denominator.
If a drawing at 1 : 200 is enlarged by a length factor of 2, its new numerical scale is 1 : 100, provided its printed size really doubles. Real distances have not changed; their representations have.
6. Apply a length factor to every matching length
 Open full-size image (opens in a new tab)
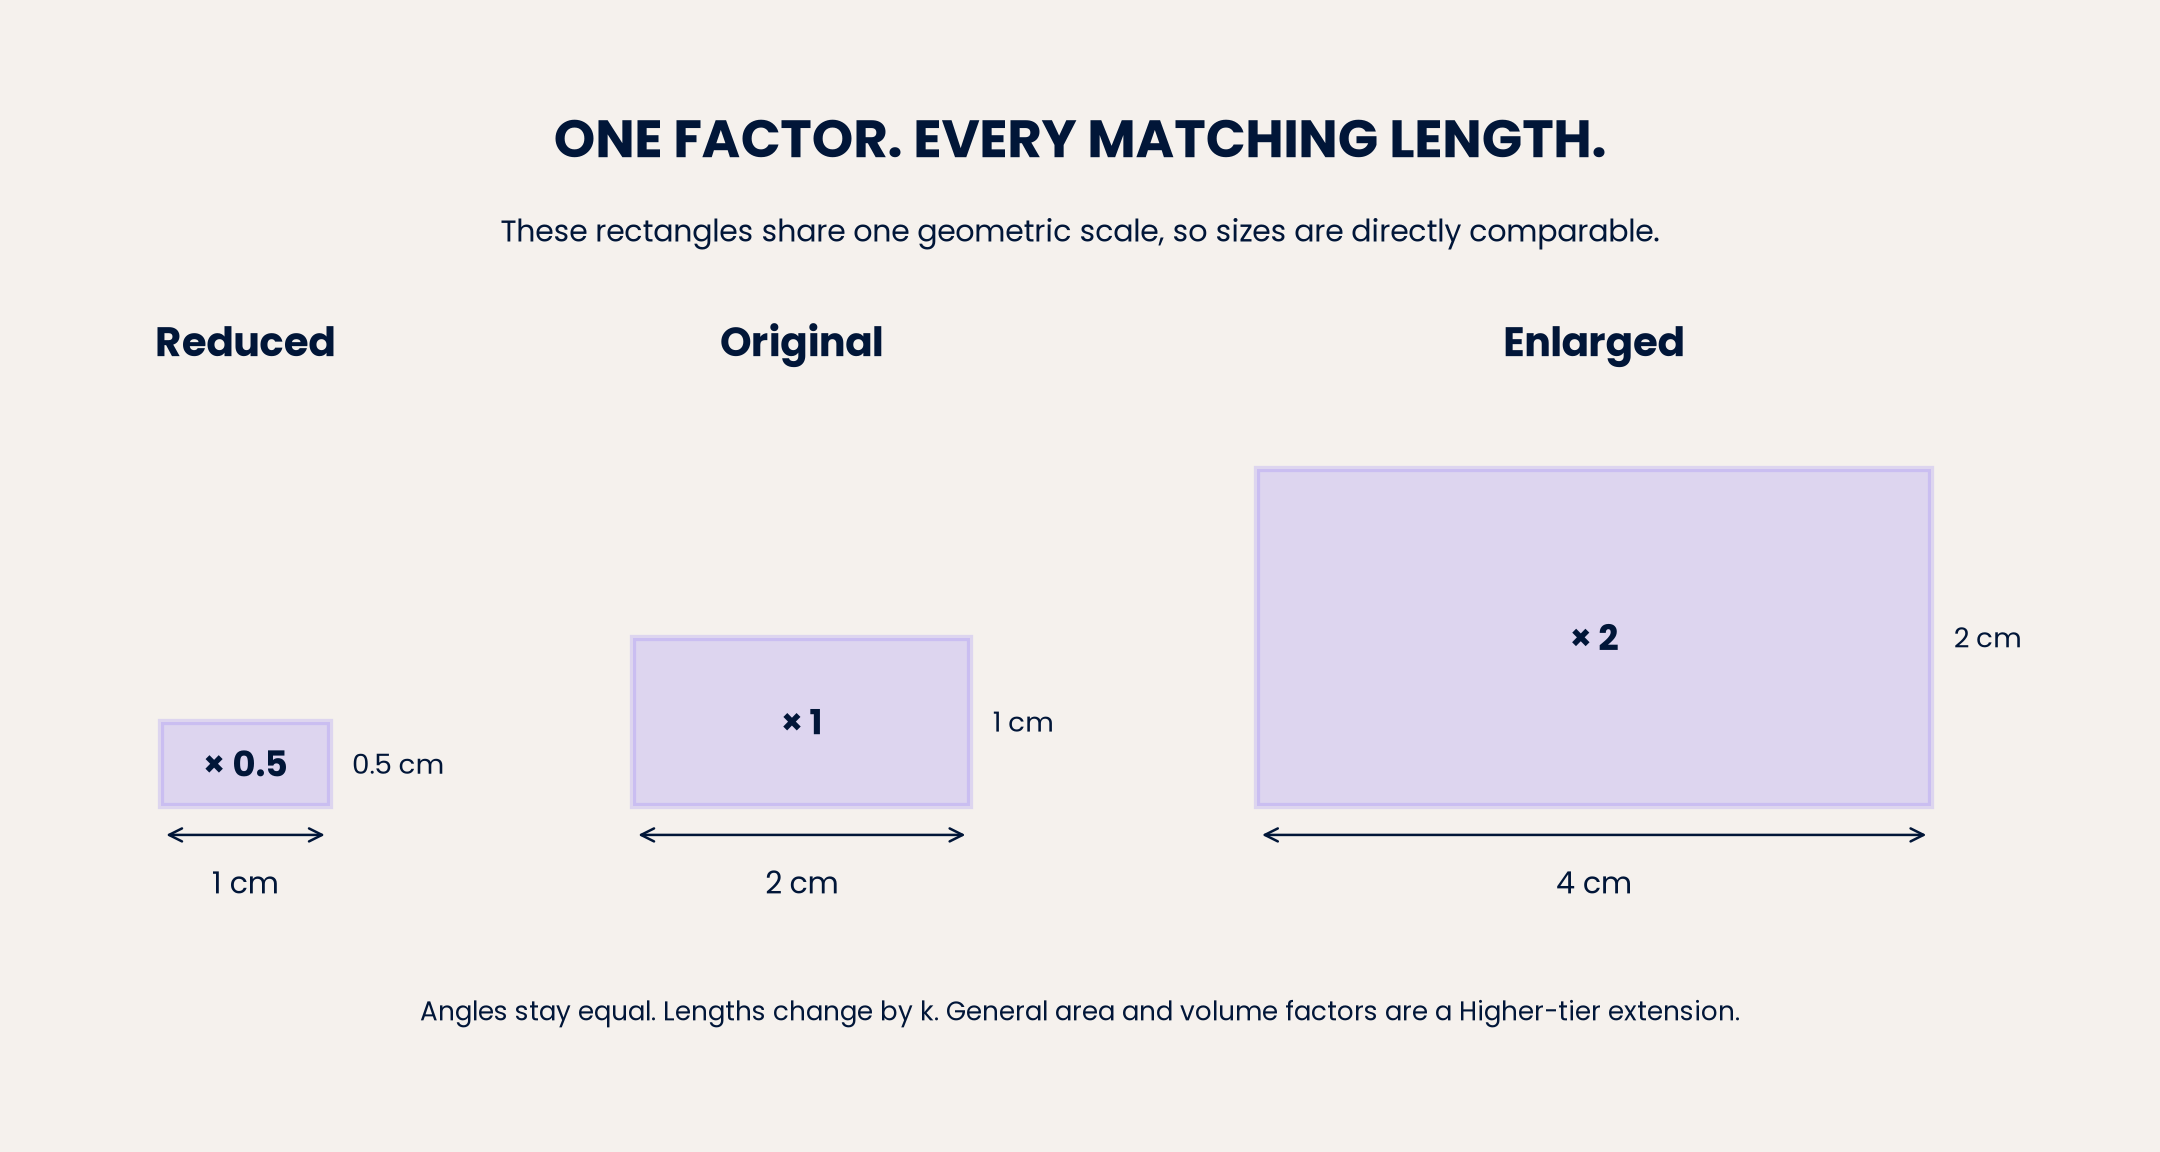
For a shape transformation, specify the direction: k = new length ÷ original corresponding length. If 4 cm becomes 10 cm, k = 10 ÷ 4 = 2.5. A matching original side of 6 cm becomes 6 × 2.5 = 15 cm. Do not add 6 cm to every side merely because one side increased by 6 cm.
For positive factors, k > 1 enlarges, 0 < k < 1 reduces and k = 1 preserves size. Corresponding angles remain equal. A factor of 0.4 makes each length 40% of its original value, a 60% reduction.
Reversing the change uses 1/k. A factor of 2.5 is reversed by 0.4. Consecutive length factors multiply: enlarging by 3 and then reducing by 0.5 has overall factor 1.5.
Tier boundary: R2 itself is both-tier content. Fractional enlargements are included at Foundation through G7. Negative enlargement factors are Higher-only G7 content and involve the centre and position of an image, not negative physical lengths. A full description of an enlargement requires its scale factor and centre. 3 4
7. Draw and measure accurately
For a 12 m by 8 m rectangular room at 1 cm represents 4 m, calculate drawing dimensions first: 12 ÷ 4 = 3 cm and 8 ÷ 4 = 2 cm. Draw a 3 cm by 2 cm rectangle using a ruler and right angles. Label the dimensions and scale where requested.
Start measurements at the ruler's zero mark, not its plastic edge. Read the correct tick marks and record enough precision for the printed diagram. AQA may specify an acceptable measurement interval in a particular mark scheme; there is no universal tolerance for every diagram.
Draw requires an accurate depiction. Sketch requires the important features but not the same measurement precision. Measure means use the appropriate instrument. Never measure a diagram marked “Not drawn accurately”. Use its given dimensions instead. 4
A screen or printer can resize an image. A numerical scale printed on it is valid only at the intended reproduction size. A scale bar remains useful after uniform resizing because the distance and bar change by the same factor. Calculate real distance = measured distance ÷ measured bar length × real bar distance, with both measurements in the same unit. Curved routes need their route length, not automatically the straight-line distance between endpoints.
Mathematical Relationships
Must memorise or be able to derive: map conversions. For map : real = 1 : n, let d be drawing length and L be real length in the same unit. Then L = nd, d = L/n, and n = L/d. The map-to-real multiplier is n; the real-to-map reduction factor is 1/n. These rules are not printed on the AQA formula sheet. 5 6
Must memorise or derive: stated scales and bars. If 1 cm represents c metres, L in metres = c × d in centimetres, and d = L/c. For a scale bar, L = (measured route length/measured bar length) × bar's real distance. All measured lengths in that quotient must use the same unit.
Must memorise or derive: shape lengths. New length = k × original length; k = new/original; reverse factor = 1/k; combined factor = k₁k₂. Perimeter also multiplies by a positive length factor k because every side does.
Must memorise: rectangle calculations used here. Area A = length × width; perimeter P = 2(length + width). Scale the lengths before applying these formulas. A 3 cm by 2 cm rectangle representing 12 m by 8 m has real area 96 m², not 6 × 4 = 24 m².
Higher-only similarity extension, G19: must memorise or derive. For similar figures with positive length factor k, new area = k² × original area, and new volume = k³ × original volume. These general similarity-factor rules are not printed on the formula sheet. Computing a rectangle's area from its scaled side lengths is still accessible at Foundation. 3
Synoptic speed relationship: must memorise or derive. Speed = distance/time; distance = speed × time; time = distance/speed. Match units, for example kilometres and hours for km/h. Given on the formula sheet: Pythagoras' theorem a² + b² = c², with c the hypotenuse, can find an unmeasured diagonal in a right-angled plan before or after scaling. 5 6
Formula-sheet update: AQA provides sheets in 2027 and for current-qualification examinations from 2028 onwards. The 2027 sheets are unchanged from 2026. A sheet does not replace understanding these scale relationships or unit conversions. 5
Graph and Data Skills
With x as map distance in centimetres and y as real distance in kilometres on a 1 : 25 000 map, y = 0.25x. The coefficient has units km per map cm. Plot (0, 0), (4, 1) and (8, 2), using labelled axes and a consistent scale; join them with a straight line through the origin.
Read x = 6.4 across to the line and then to the y-axis: y = 1.6. To reverse the calculation, start at y = 1.6 and read back to x = 6.4. The gradient 0.25 means 0.25 km per map centimetre, not the map ratio 1 : 0.25. Check subdivisions before reading a graph. This is a direct-proportion link to R10 and R14, not a separate Higher-only requirement. 1
Practical Applications
Maps support route planning; floor plans let architects test furniture layouts; model makers preserve an object's proportions. If a mapped route is 1.6 km and a walker averages 4 km/h, time = 1.6 ÷ 4 = 0.4 hours = 24 minutes. This assumes constant average speed and the measured route, not an unmeasured shortcut.
There is no required science practical for this Mathematics topic. A useful drawing task is to measure a desk, choose a stated scale, calculate both drawing dimensions and draw it accurately. Equipment: ruler, pencil, paper and a tape measure. Check by converting your drawn dimensions back to real lengths. The examination assesses the mathematics and accurate drawing, not a science-practical write-up.
Why/what if: what changes if the map is enlarged but its scale label is not updated? What remains reliable if its scale bar enlarges too? Explain using ratios rather than “it looks bigger”.
What an official AQA mark scheme rewards
In November 2024, Foundation Paper 2, Question 17, a scale-and-comparison item carries 3 marks. The correct conversion takes 7 cm at scale 1 : 4000 to 28 000 cm, then 280 m; the required decision is No. The official scheme offers up to two method marks, labelled M2 for the completed method, and one accuracy mark for the correct value and decision. An initial valid conversion step can receive M1 even if the final answer is wrong. M2 is the cumulative two-method-mark level, not two extra marks after M1. 7
The examiner report identifies a common error: comparing 28 000 with 300 without aligning centimetres and metres. State the decision as well as supporting it mathematically. This item supplies the map length, so no ruler tolerance applies. Its specific marking rules must not be generalised into a universal one-mark-per-step rule. 7 8
Podcast: listen, pause and retrieve
The ten-minute episode uses a warm female British tutor voice: 00:00 introduction; 01:00 core concepts; 06:00 exam tips; 08:00 quick-fire recall; 09:00 summary. Answer before the tutor supplies each answer. Follow listening with one forward and one reverse calculation from memory, then revisit them tomorrow and a few days later.
References and downloads
Try the lesson
The start of the Ratio, proportion and rates of change: use scale factors, scale diagrams and maps lesson, made from checked teaching notes for this specification point.
Have a go first
On a map, a path measures 6 cm. The map scale is 1 cm to 4 km. Work out the real length of the path in kilometres.
Listen
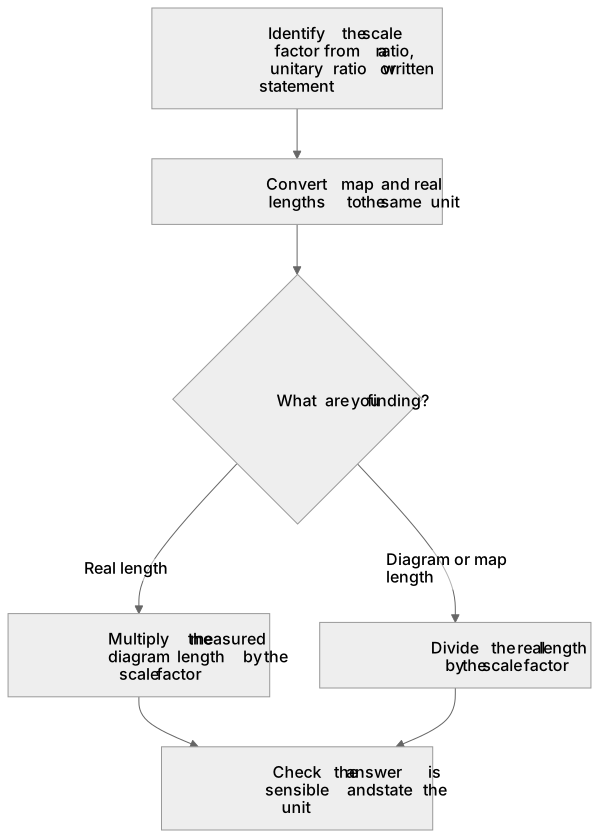
A scale factor compares a length on a scale diagram or map with the matching real length. If a map has scale 1 : 25 000, then 1 cm on the map represents 25 000 cm in real life, which is 250 m. To find a real distance, measure the map length and multiply by the scale factor; to find a map length, divide the real length by the same factor. For a scale diagram, the scale factor may be given as a ratio, a unitary ratio or a statement such as '1 cm represents 4 m'. Always convert units so that the map length and real length use the same unit before multiplying or dividing. Enlargements also use scale factors: a factor greater than 1 enlarges, a factor between 0 and 1 reduces, and the factor applies to every corresponding length. A strong answer earns marks for these points. Identify the scale factor from a ratio, unitary ratio or written statement. Convert map and real lengths to the same unit before calculating. Multiply a measured diagram length by the scale factor to find the real length. Divide a real length by the scale factor to find the diagram or map length. A common slip: Using the scale ratio the wrong way round: for 1 : 25 000, multiplying a real length by 25 000 instead of dividing. Instead, checking whether the answer should be larger or smaller than the given length. Exam tip: Write the scale as a unitary ratio, such as 1 cm : 250 m, before calculating so the direction of the conversion is clear.
See it
Watch it explained
What is the one idea the video explains? Say it in a sentence.
Read the described scene instead
A scale factor compares a length on a scale diagram or map with the matching real length. Maps and diagrams use ratio notation, unitary ratios, or written statements. In this lesson, you will use scale factors to move between diagram and real lengths, converting units when needed. A scale can be written as a ratio, such as one to twenty-five thousand. A unitary ratio shows one unit on the diagram compared with a real distance, for example one centimetre to two hundred and fifty metres. A written statement such as one centimetre represents four metres also gives the scale factor. Before calculating, put the map length and the real length into the same unit. For a scale of one to twenty-five thousand, one centimetre on the map represents twenty-five thousand centimetres in real life. Since one hundred centimetres make one metre, twenty-five thousand centimetres equals two hundred and fifty metres. Always state the unit in your answer. Suppose a map has scale one to twenty-five thousand. A path measures four centimetres on the map. Pause and think: should the real distance be larger or smaller than four centimetres? The real length is four centimetres multiplied by twenty-five thousand, which is one hundred thousand centimetres. Convert to metres: one hundred thousand centimetres equals one thousand metres, or one kilometre. Check: the real distance should be larger than the map distance. Two common errors are using the scale ratio the wrong way round and forgetting to convert units. If you need a real length, multiply the map length by the scale factor; if you need a map length, divide the real length by the scale factor. Also, do not add the scale factor instead of multiplying. A scale factor between zero and one reduces every corresponding length; it does not enlarge the shape. To use a scale factor, identify the scale from a ratio, unitary ratio, or written statement. Convert all lengths to the same unit. To find a real length, multiply the map length by the scale factor; to find a map length, divide the real length by the scale factor. A factor greater than one enlarges; a factor between zero and one reduces. Check whether your answer is sensible.
Key words
Say what each word means before you turn the card.
Scale factor
Try answering aloud or in your head before turning the card.
Enlargement
Try answering aloud or in your head before turning the card.
Reduction
Try answering aloud or in your head before turning the card.
See every definition
- Scale factor
- Compares a length on a scale diagram or map with the matching real length.
- Enlargement
- Uses a scale factor greater than 1, and the factor applies to every corresponding length.
- Reduction
- Uses a scale factor between 0 and 1, which reduces every corresponding length.
Label the diagram
Some boxes have lost their names. Pick the right name for each number.
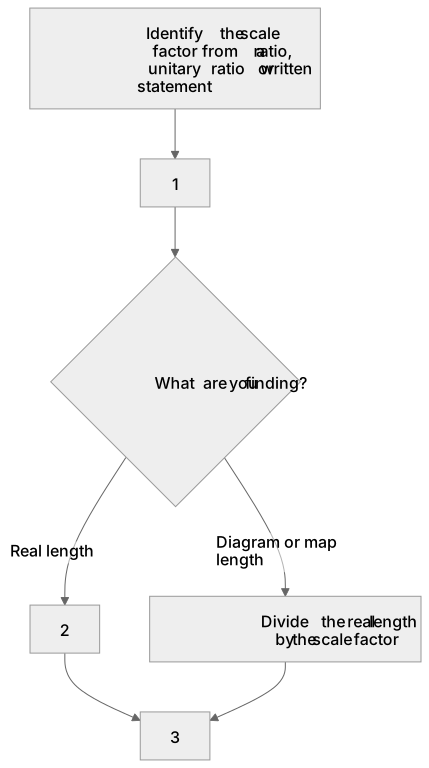
1Box 1
2Box 2
3Box 3
There is more to this lesson
The full lesson goes on to check your understanding and help you earn the marks. Create a free account to carry on, with your progress saved.
A week of Premium from your first lesson · Then the free plan continues · No card, no charge
Worked Examples
4 worked examples — open one to explore the question and available guidance.
Practice Questions
Try the question, then reveal an answer plan or example response
Original AQA-style, both tiers. A map scale is 1 : 50 000. State the real distance represented by 1 cm in metres. Work out the real distance represented by 3.6 cm in kilometres.
Hint: Change 50 000 cm into metres before using the 3.6 cm measurement.
Original AQA-style, both tiers. A plan uses 1 cm to represent 2.5 m. Work out the drawing length for a real wall 18.75 m long. Write the numerical scale in the form 1 : n.
Hint: Divide the real length by the real metres represented by each plan centimetre.
Original AQA-style, both tiers. A model car is 84 mm long. The real car is 4.2 m long. Work out the model : real scale in the form 1 : n. Then work out the model width if the real car is 1.8 m wide.
Hint: Put the car lengths into millimetres first.
Original AQA-style, both tiers. A map's 500 m scale bar measures 2 cm. A route on that same image measures 7.2 cm. Work out the real route length in kilometres. The entire image is then enlarged by a factor of 1.5. Work out the new measured route and bar lengths, and explain whether the real route length changes.
Hint: First find how many scale-bar lengths fit into the route. Both measured lengths enlarge together.
Original AQA-style, both tiers. On a fixed-scale map, real distance y in kilometres and map distance x in centimetres satisfy y = 0.25x. Work out y when x = 7.2, then x when y = 2.5. State what the gradient means and explain why the graph passes through the origin.
Hint: Use multiplication in the first part and divide by 0.25 in the reverse part. Include units when interpreting the gradient.
Original AQA-style, both tiers. A rectangular garden measures 5.4 cm by 3.6 cm on a plan with scale 1 : 200. Work out its real length and width in metres, its perimeter and its area. Explain why multiplying the plan-area number by 200 does not give the real-area number in square centimetres.
Hint: Scale both side lengths before calculating perimeter and area. Area has two length dimensions.
Original AQA-style, Higher-only G19 extension. Two similar solid models have corresponding lengths 4 cm and 10 cm, smaller to larger. The smaller model has surface area 32 cm² and volume 48 cm³. Work out the larger model's surface area and volume.
Hint: Find the directed length factor first; square it for surface area and cube it for volume.
Ready to test yourself interactively?
Active recall beats reading alone. Answer questions on Ratio, proportion and rates of change: use scale factors, scale diagrams and maps with instant AI scoring and mark scheme guidance.
A week of Premium from your first lesson · Then the free plan continues · No card, no charge
Exam technique
How to turn what you know into marks
How to approach the question
Underline the command word and requested unit. Identify whether the given scale is map : real or a directed shape factor. Write a unitary scale statement, or match units for a numerical ratio. Select multiplication or division, show the calculation, then check that the physical size makes sense. Use given measurements rather than screen measurements unless working with a scale bar.
How to structure your answer
For a short numerical question, write the scale interpretation, substitution and final value with the requested unit. For a multi-part problem, label parts and retain useful unrounded values. For Draw, calculate all drawing dimensions first and use accurate instruments. For a reason or method critique, include a specific calculation and explain what it demonstrates. Marks are not awarded automatically one per written line.
Timing
Each AQA 8300 paper has 80 marks in 90 minutes, equivalent to 1.125 minutes per mark overall. A useful working target is about 1 minute per mark, leaving approximately 10 minutes for checking. Allow roughly 3–4 minutes for 3 marks and 6–7 minutes for 6 marks, but adjust for drawing and question difficulty. This is revision advice, not an AQA timing rule.
Common pitfalls
- Reversing the scale: name the direction before deciding whether to multiply or divide.
- Treating 25 000 cm as 25 000 m: divide centimetres by 100 to obtain metres.
- Writing 1 cm : 250 m as numerical ratio 1 : 250: convert 250 m to 25 000 cm first.
- Adding a factor rather than multiplying: every corresponding length is multiplied by the same k.
- Assuming a positive factor below 1 enlarges: it reduces every length.
- Scaling area by the length factor: use the new side lengths, or k² for the Higher similarity extension.
- Measuring a resized screen image or an inaccurate diagram: use supplied measurements or its uniformly resized scale bar.
- Rounding intermediate values unnecessarily: keep exact fractions or full calculator values until the final requested rounding.
What the command words want
- Sketch
- Show the important features and labels; the same measurement accuracy as Draw is not required.
- Compare
- Find the relevant values and state which is larger or smaller in context. For the same real length, a 1 : 100 drawing is larger than a 1 : 200 drawing.
- Measure
- Use a ruler for a length or protractor for an angle on the correctly reproduced diagram.
- Describe
- Use precise mathematical terminology. For an enlargement described fully, give the scale factor and centre, even if fully is not written.
- Estimate
- Use the given information to obtain an approximate answer. For estimating a numerical calculation, AQA normally expects values rounded to 1 significant figure unless told otherwise; for a measured distance, retain sensible measurement precision.
- Evaluate
- For an AQA mathematical method or claim, identify what is incorrect or explain why it must be correct using evidence. AQA labels this method/claim command Higher-only. It is not a generic 'consider both sides' essay.
- Show that
- Give all steps leading to the stated result rather than simply repeating it.
- State/Give
- Supply the requested information. A number, ratio or unit may be needed, so do not impose a fixed word limit. Give a reason is different: it needs evidence.
- Write down
- The answer should be obtainable directly from the information given without calculation.
- Draw/Construct
- Produce an accurate drawing using the specified instruments. Show construction arcs if instructed.
- Calculate/Work out
- Perform the required calculation, show a valid method and give the requested unit and accuracy. Obey any explicit instruction to show working.
- Explain/Why/Give a reason
- Support the claim with mathematical reasoning or a calculation. For example, 'The answer must be divided by 250 because each map centimetre represents 250 real metres.'
Test your understanding of Ratio, proportion and rates of change: use scale factors, scale diagrams and maps
Active recall beats re-reading. Take an instant quiz now to test what you’ve learned and lock it into long-term memory.
A week of Premium from your first lesson · Then the free plan continues · No card, no charge