Pearson Edexcel · A-Level · Mathematics
Course version: 9MA0 · Version from Mar 2026
Interpret diagrams for single-variable data, including understanding that…
Full specification wording
Data presentation and interpretation: 2.1 Interpret diagrams for single-variable data, including understanding that area in a histogram represents frequency. Connect to probability distributions.
Single-variable diagrams summarise one measured variable.
Checked against the Pearson Edexcel 9MA0 specification (opens in a new tab) on .
- Point 1 of 4
- 4 key terms
Study notes
From the checked teaching notes for this specification point.
The idea
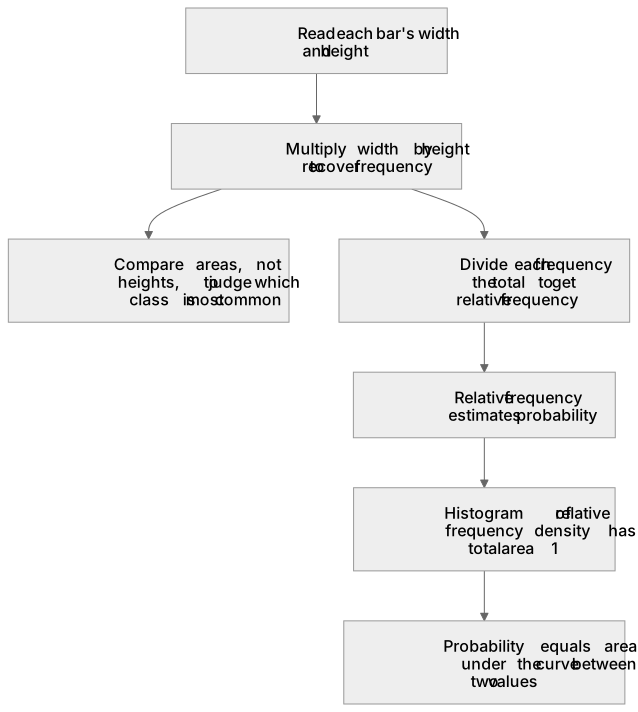
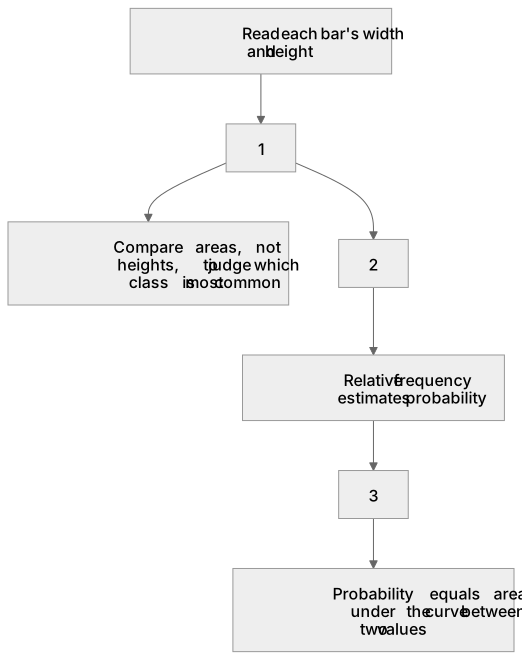
Single-variable diagrams summarise one measured variable. In a histogram, unequal class widths mean frequency is represented by the area of each bar, not its height. Frequency density is frequency divided by class width, so a bar of width 5 and height 4 represents a frequency of 20. To interpret such a diagram, read each bar's width and height, multiply them to recover frequency, and compare areas when judging which class is most common. This links directly to probability distributions: relative frequency, found by dividing each frequency by the total, estimates probability, and a histogram of relative frequency density has total area 1. Thus the same area principle underlies continuous probability density functions, where probability equals the area under the curve between two values.
What earns the marks
- States that in a histogram with unequal class widths, frequency equals frequency density multiplied by class width, so area represents frequency.
- Calculates a missing frequency by multiplying a bar's height by its class width, and a missing height by dividing frequency by class width.
- Compares classes correctly by area rather than by bar height when class widths differ.
- Explains that relative frequency estimates probability and that total relative frequency is 1.
- Links histogram area to probability density, where probability corresponds to area under a curve between two values.
Common mistakes and how to put them right
Treating bar height as frequency when class widths are unequal.
Put it right: Multiply height by width to obtain frequency.
Forgetting to divide frequency by class width when drawing or completing a histogram.
Put it right: Plot frequency density on the vertical axis.
Assuming a histogram's total area equals the total frequency.
Put it right: Total area equals total frequency only when frequency density is used, whereas relative frequency density gives total area 1.
Exam tips
- Label the vertical axis frequency density and show one area calculation to justify a frequency you read from a histogram.
- When asked to compare two classes, quote both areas and state the conclusion in the context of the data.
- Convert frequencies to relative frequencies before discussing probability, and check that they sum to 1.
Try the lesson
The start of the Data presentation and interpretation: 2.1 Interpret diagrams for single-variable data, including understanding that area in a histogram represents frequency. Connect to probability distributions. lesson, made from checked teaching notes for this specification point.
Have a go first
A histogram is drawn for a data set. One bar covers the interval from 10 to 14 on the horizontal axis and has height 6. What does the area of this bar represent?
Listen
Single-variable diagrams summarise one measured variable. In a histogram, unequal class widths mean frequency is represented by the area of each bar, not its height. Frequency density is frequency divided by class width, so a bar of width 5 and height 4 represents a frequency of 20. To interpret such a diagram, read each bar's width and height, multiply them to recover frequency, and compare areas when judging which class is most common. This links directly to probability distributions: relative frequency, found by dividing each frequency by the total, estimates probability, and a histogram of relative frequency density has total area 1. Thus the same area principle underlies continuous probability density functions, where probability equals the area under the curve between two values. A strong answer earns marks for these points. States that in a histogram with unequal class widths, frequency equals frequency density multiplied by class width, so area represents frequency. Calculates a missing frequency by multiplying a bar's height by its class width, and a missing height by dividing frequency by class width. Compares classes correctly by area rather than by bar height when class widths differ. Explains that relative frequency estimates probability and that total relative frequency is 1. A common slip: Treating bar height as frequency when class widths are unequal. Instead, multiply height by width to obtain frequency. Exam tip: Label the vertical axis frequency density and show one area calculation to justify a frequency you read from a histogram.
See it
Key words
Say what each word means before you turn the card.
Frequency density
Try answering aloud or in your head before turning the card.
Relative frequency
Try answering aloud or in your head before turning the card.
Probability density
Try answering aloud or in your head before turning the card.
Histogram
Try answering aloud or in your head before turning the card.
See every definition
- Frequency density
- Frequency divided by class width, so that a bar of width 5 and height 4 represents a frequency of 20.
- Relative frequency
- Found by dividing each frequency by the total, and estimates probability, with total relative frequency equal to 1.
- Probability density
- The same area principle underlies continuous probability density functions, where probability equals the area under the curve between two values.
- Histogram
- A diagram for single-variable data in which unequal class widths mean frequency is represented by the area of each bar, not its height.
Label the diagram
Some boxes have lost their names. Pick the right name for each number.
1Box 1
2Box 2
3Box 3
There is more to this lesson
The full lesson goes on to check your understanding and help you earn the marks. Create a free account to carry on, with your progress saved.
A week of Premium from your first lesson · Then the free plan continues · No card, no charge
Test your understanding of Data presentation and interpretation: 2.1 Interpret diagrams for single-variable data, including understanding that area in a histogram represents frequency. Connect to probability distributions.
Active recall beats re-reading. Take an instant quiz now to test what you’ve learned and lock it into long-term memory.
A week of Premium from your first lesson · Then the free plan continues · No card, no charge