Pearson Edexcel · A-Level · Mathematics
Course version: 9MA0 · Version from Mar 2026
Interpret scatter diagrams and regression lines for bivariate data,…
Full specification wording
Data presentation and interpretation: 2.2 Interpret scatter diagrams and regression lines for bivariate data, including recognition of scatter diagrams which include distinct sections of the population (calculations involving regression lines are excluded). Understand informal interpretation of correlation. Understand that correlation does not imply causation.
Bivariate data pairs two variables for each individual.
Checked against the Pearson Edexcel 9MA0 specification (opens in a new tab) on .
- Point 2 of 4
- 4 key terms
Study notes
From the checked teaching notes for this specification point.
The idea
Bivariate data pairs two variables for each individual. A scatter diagram plots one variable against the other, and a regression line summarises a linear trend, allowing a prediction of one variable from the other within the observed range. Interpretation means describing direction, strength and form, and recognising distinct sections of the population, such as two clusters or a group of points that follow a different pattern; these may indicate subgroups that should be described separately rather than forced into one line. Correlation is an informal measure of how closely points follow a straight line, from strong positive through weak to strong negative. Crucially, correlation does not imply causation: a third variable or coincidence may explain the association, so causal claims need evidence beyond the scatter diagram.
What earns the marks
- Describes a scatter diagram in terms of direction, strength and form of association between the two variables.
- Interprets a regression line as a model of a linear trend and uses it to predict one variable from the other within the data range.
- Recognises distinct sections or clusters in a scatter diagram and describes each subgroup separately.
- Explains informally what a correlation coefficient indicates about the closeness of points to a straight line.
- States that correlation does not imply causation and suggests a possible confounding or alternative explanation.
Common mistakes and how to put them right
Describing a correlation as proof that one variable causes the other.
Put it right: Say the association may be explained by a third variable or by chance.
Ignoring separate clusters and fitting one description to all points.
Put it right: Identify the distinct sections and describe each one.
Predicting far outside the range of the observed data.
Put it right: Restrict predictions to values within the data range.
Exam tips
- Use the words positive, negative, strong, weak and linear when describing association, and quote the context of the variables.
- When a diagram shows clusters, state how many sections you see and describe the trend within each.
- For any causal-sounding question, add a sentence explaining why correlation alone cannot establish cause.
Try the lesson
The start of the Data presentation and interpretation: 2.2 Interpret scatter diagrams and regression lines for bivariate data, including recognition of scatter diagrams which include distinct sections of the population (calculations involving regression lines are excluded). Understand informal interpretation of correlation. Understand that correlation does not imply causation. lesson, made from checked teaching notes for this specification point.
Have a go first
A scatter diagram shows points that lie close to a straight line sloping downwards from left to right. What type of correlation does this indicate?
Listen
Bivariate data pairs two variables for each individual. A scatter diagram plots one variable against the other, and a regression line summarises a linear trend, allowing a prediction of one variable from the other within the observed range. Interpretation means describing direction, strength and form, and recognising distinct sections of the population, such as two clusters or a group of points that follow a different pattern; these may indicate subgroups that should be described separately rather than forced into one line. Correlation is an informal measure of how closely points follow a straight line, from strong positive through weak to strong negative. Crucially, correlation does not imply causation: a third variable or coincidence may explain the association, so causal claims need evidence beyond the scatter diagram. A strong answer earns marks for these points. Describes a scatter diagram in terms of direction, strength and form of association between the two variables. Interprets a regression line as a model of a linear trend and uses it to predict one variable from the other within the data range. Recognises distinct sections or clusters in a scatter diagram and describes each subgroup separately. Explains informally what a correlation coefficient indicates about the closeness of points to a straight line. A common slip: Describing a correlation as proof that one variable causes the other. Instead, say the association may be explained by a third variable or by chance. Exam tip: Use the words positive, negative, strong, weak and linear when describing association, and quote the context of the variables.
See it
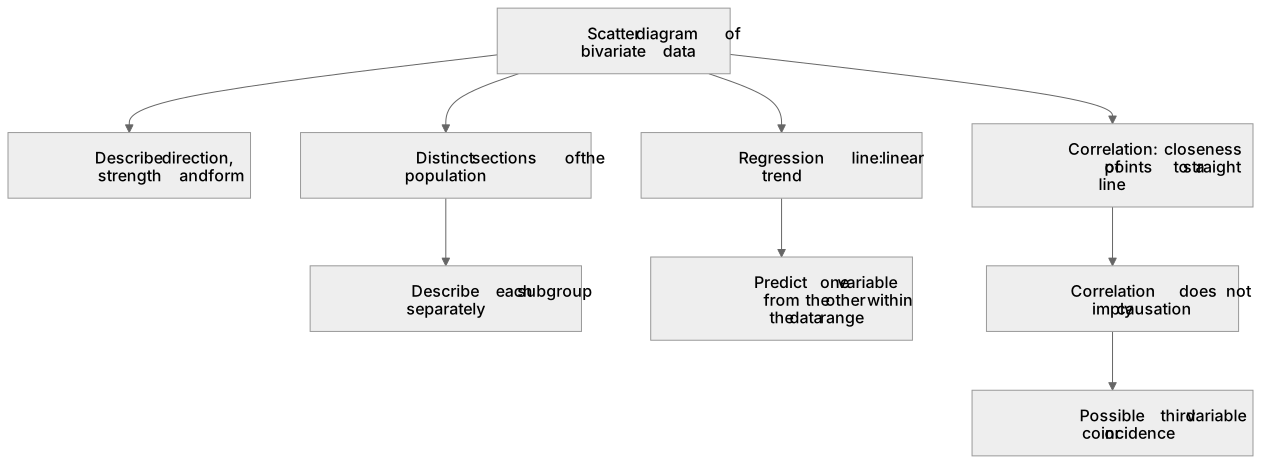
Key words
Say what each word means before you turn the card.
Scatter diagrams
Try answering aloud or in your head before turning the card.
Regression lines
Try answering aloud or in your head before turning the card.
Distinct sections of the population
Try answering aloud or in your head before turning the card.
Correlation
Try answering aloud or in your head before turning the card.
See every definition
- Scatter diagrams
- Plots one variable against the other for paired bivariate data, and interpretation means describing direction, strength and form.
- Regression lines
- Summarises a linear trend, allowing a prediction of one variable from the other within the observed range.
- Distinct sections of the population
- Two clusters or a group of points that follow a different pattern, which may indicate subgroups that should be described separately rather than forced into one line.
- Correlation
- An informal measure of how closely points follow a straight line, from strong positive through weak to strong negative.
Label the diagram
Some boxes have lost their names. Pick the right name for each number.
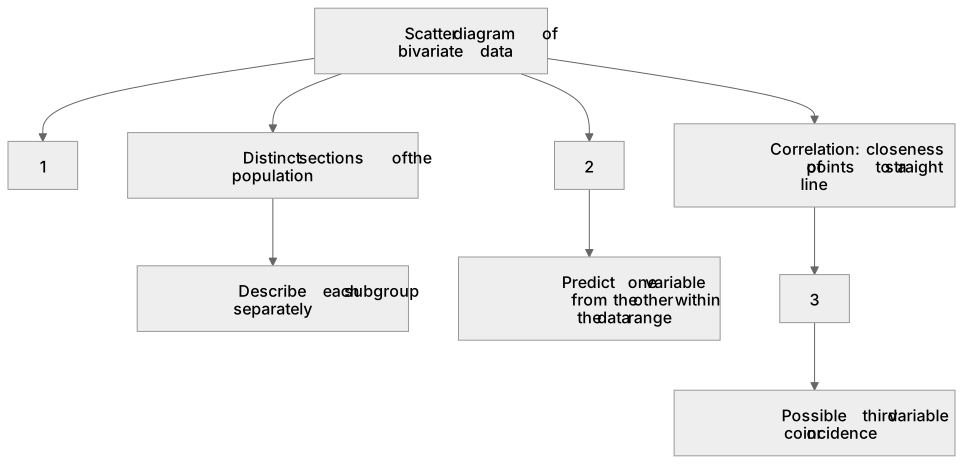
1Box 1
2Box 2
3Box 3
There is more to this lesson
The full lesson goes on to check your understanding and help you earn the marks. Create a free account to carry on, with your progress saved.
A week of Premium from your first lesson · Then the free plan continues · No card, no charge
Test your understanding of Data presentation and interpretation: 2.2 Interpret scatter diagrams and regression lines for bivariate data, including recognition of scatter diagrams which include distinct sections of the population (calculations involving regression lines are excluded). Understand informal interpretation of correlation. Understand that correlation does not imply causation.
Active recall beats re-reading. Take an instant quiz now to test what you’ve learned and lock it into long-term memory.
A week of Premium from your first lesson · Then the free plan continues · No card, no charge