Pearson Edexcel · GCSE · Mathematics
Course version: 1MA1 · Version from Mar 2026
Construct and interpret diagrams for grouped discrete data and continuous…
Full specification wording
Statistics: construct and interpret diagrams for grouped discrete data and continuous data, i.e. histograms with equal and unequal class intervals and cumulative frequency graphs, and know their appropriate use (Higher tier only)
A histogram shows frequency by area, not height.
Checked against the Pearson Edexcel 1MA1 specification (opens in a new tab) on .
- Point 3 of 7
- 3 key terms
Study notes
From the checked teaching notes for this specification point.
The idea
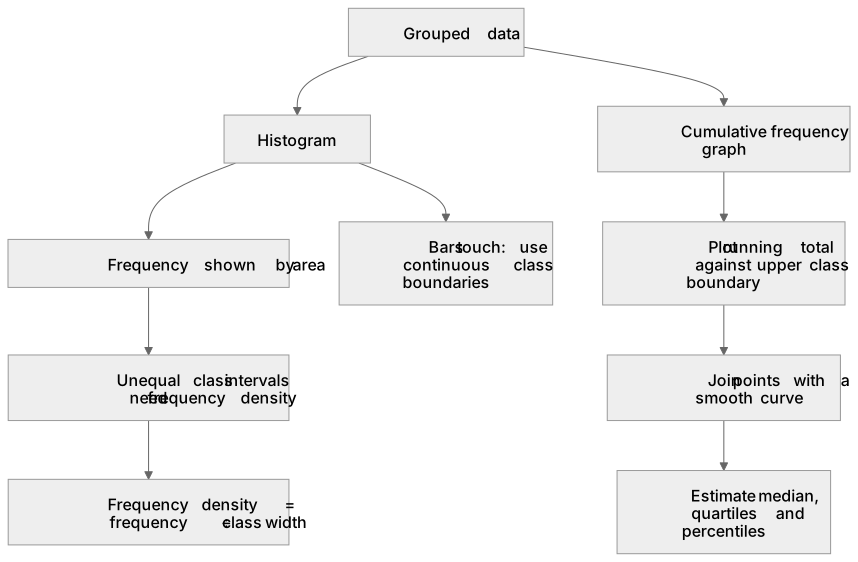
A histogram shows frequency by area, not height. For unequal class intervals the vertical axis must be frequency density, calculated as frequency ÷ class width. The area of each bar (width × frequency density) then equals the frequency. For grouped discrete data, e.g. ages 1–10, 11–20, continuous class boundaries are needed so bars touch; use halfway points such as 0.5–10.5, 10.5–20.5. For continuous data grouped as 0 ≤ x < 10, 10 ≤ x < 20, the boundaries are simply 0, 10, 20. A cumulative frequency graph plots a running total of frequencies against the upper class boundary of each interval, and the points are joined by a smooth curve. This graph is used to estimate the median (at the n/2 value), quartiles (n/4 and 3n/4) and other percentiles. Use a histogram to see the shape of a distribution; use a cumulative frequency graph to estimate medians and quartiles.
What earns the marks
- Calculate at least one correct frequency density where the method (frequency ÷ class width) is clear.
- Draw histogram bars with correct widths corresponding to the continuous class boundaries, with no gaps between them.
- Draw bar heights corresponding to the calculated frequency densities.
- Plot cumulative frequency points accurately against the upper class boundary for each interval.
- Join the plotted cumulative frequency points with a smooth curve, starting from the lowest boundary on the horizontal axis.
- Clearly show reading lines on a cumulative frequency graph when estimating the median, quartiles or percentiles.
- Choose an appropriate diagram for a given purpose, e.g. a histogram to compare frequencies across classes or a cumulative frequency graph to estimate the median.
Common mistakes and how to put them right
Plotting frequency on the vertical axis of a histogram when class widths are unequal.
Put it right: The vertical axis must be frequency density (frequency ÷ class width).
Plotting cumulative frequency against class midpoints instead of upper class boundaries.
Put it right: Cumulative frequency is a running total up to the end of an interval, so it must be plotted at the upper boundary.
For grouped discrete data (e.g. 1–10, 11–20), drawing bars with gaps between them.
Put it right: A histogram's bars must touch; use continuous class boundaries halfway between the discrete intervals, e.g. 0.5–10.5, 10.5–20.5.
Joining cumulative frequency points with straight line segments.
Put it right: Join them with a smooth curve, as required for Edexcel GCSE.
Exam tips
- Before drawing a histogram, add two columns to the table: one for class width and one for frequency density. This organises your calculations.
- Always draw the lines on the cumulative frequency graph that you used to find an estimate. This allows you to be awarded method marks even if your reading is slightly inaccurate.
Try the lesson
The start of the Statistics: construct and interpret diagrams for grouped discrete data and continuous data, i.e. histograms with equal and unequal class intervals and cumulative frequency graphs, and know their appropriate use (Higher tier only) lesson, made from checked teaching notes for this specification point.
Have a go first
A histogram has a class interval 10 < x ≤ 20 with frequency 30. The class width is 10. What is the frequency density?
Listen
A histogram shows frequency by area, not height. For unequal class intervals the vertical axis must be frequency density, calculated as frequency ÷ class width. The area of each bar (width × frequency density) then equals the frequency. For grouped discrete data, e.g. ages 1–10, 11–20, continuous class boundaries are needed so bars touch; use halfway points such as 0.5–10.5, 10.5–20.5. For continuous data grouped as 0 ≤ x < 10, 10 ≤ x < 20, the boundaries are simply 0, 10, 20. A cumulative frequency graph plots a running total of frequencies against the upper class boundary of each interval, and the points are joined by a smooth curve. This graph is used to estimate the median (at the n/2 value), quartiles (n/4 and 3n/4) and other percentiles. Use a histogram to see the shape of a distribution; use a cumulative frequency graph to estimate medians and quartiles. A strong answer earns marks for these points. Calculate at least one correct frequency density where the method (frequency ÷ class width) is clear. Draw histogram bars with correct widths corresponding to the continuous class boundaries, with no gaps between them. Draw bar heights corresponding to the calculated frequency densities. Plot cumulative frequency points accurately against the upper class boundary for each interval. A common slip: Plotting frequency on the vertical axis of a histogram when class widths are unequal. Instead, the vertical axis must be frequency density (frequency ÷ class width). Exam tip: Before drawing a histogram, add two columns to the table: one for class width and one for frequency density. This organises your calculations.
See it
Key words
Say what each word means before you turn the card.
Frequency density
Try answering aloud or in your head before turning the card.
Cumulative frequency graph
Try answering aloud or in your head before turning the card.
Histogram
Try answering aloud or in your head before turning the card.
See every definition
- Frequency density
- The vertical axis value for a histogram with unequal class intervals, calculated as frequency ÷ class width, so that the area of each bar equals the frequency.
- Cumulative frequency graph
- A plot of a running total of frequencies against the upper class boundary of each interval, with the points joined by a smooth curve and used to estimate the median, quartiles and other percentiles.
- Histogram
- A diagram showing frequency by area, not height, used to see the shape of a distribution and drawn with bars that touch.
Label the diagram
Some boxes have lost their names. Pick the right name for each number.
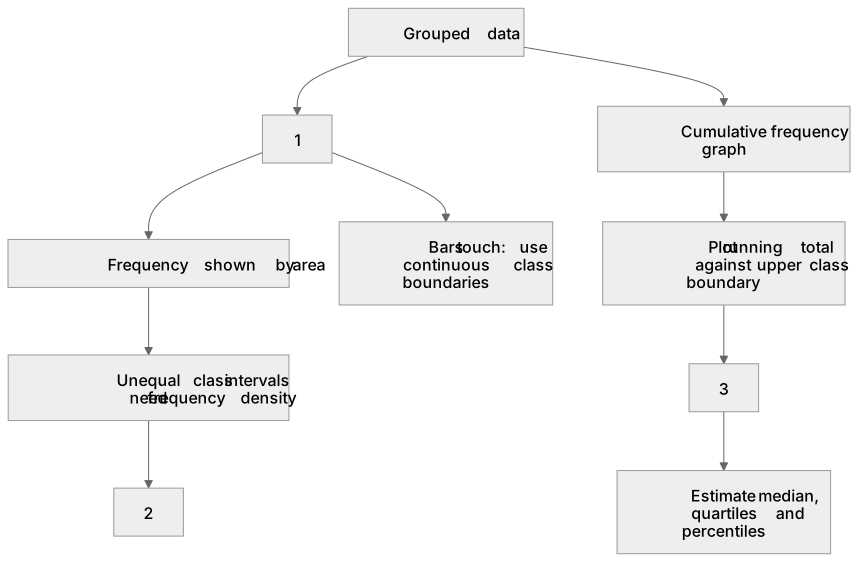
1Box 1
2Box 2
3Box 3
There is more to this lesson
The full lesson goes on to check your understanding and help you earn the marks. Create a free account to carry on, with your progress saved.
A week of Premium from your first lesson · Then the free plan continues · No card, no charge
Test your understanding of Statistics: construct and interpret diagrams for grouped discrete data and continuous data, i.e. histograms with equal and unequal class intervals and cumulative frequency graphs, and know their appropriate use (Higher tier only)
Active recall beats re-reading. Take an instant quiz now to test what you’ve learned and lock it into long-term memory.
A week of Premium from your first lesson · Then the free plan continues · No card, no charge