AQA · A-Level · Physics
Course version: 7408 · Version from Sept 2016
Bulk properties of solids: Interpretation of simple stress–strain curves.
A stress–strain curve plots stress (force per unit cross-sectional area, σ = F/A, in Pa) on the vertical axis against strain (fractional extension, ε = ΔL/L, dimensionless) on the horizontal axis.
Checked against the AQA 7408 specification (opens in a new tab) on .
- Point 7 of 8
- 4 key terms
Study notes
From the checked teaching notes for this specification point.
The idea
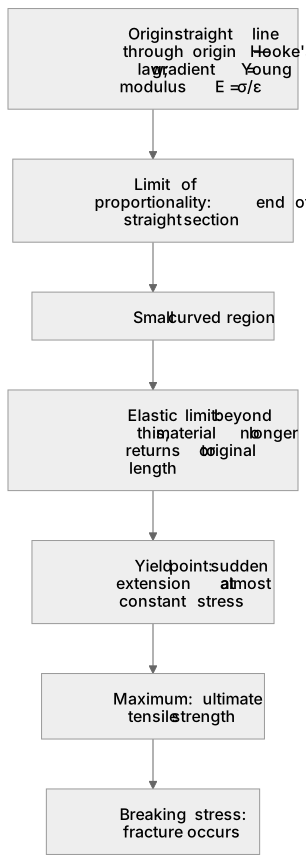
A stress–strain curve plots stress (force per unit cross-sectional area, σ = F/A, in Pa) on the vertical axis against strain (fractional extension, ε = ΔL/L, dimensionless) on the horizontal axis. The initial straight section through the origin shows Hooke's law behaviour, where stress is proportional to strain; its gradient equals the Young modulus E = σ/ε, in Pa. The limit of proportionality is where this straight line ends. A small curved region follows until the elastic limit, beyond which the material no longer returns to its original length. A yield point may appear as a sudden extension at almost constant stress. The maximum is the ultimate tensile strength, and the breaking stress is where fracture occurs. The area under the curve represents energy per unit volume, so a tougher material absorbs more energy before breaking.
What earns the marks
- Identify the straight-line region through the origin as Hooke's law behaviour and state that its gradient gives the Young modulus E = σ/ε.
- Locate the limit of proportionality at the end of the straight section and distinguish it from the elastic limit, beyond which permanent deformation occurs.
- Recognise a yield point as a large extension for little extra stress, typical of a ductile material such as mild steel.
- Read the ultimate tensile strength from the highest point of the curve and the breaking stress from the point of fracture.
- Explain that the area under the curve represents energy absorbed per unit volume before fracture, linking a larger area to a tougher material.
- Compare curves for different materials, for example a brittle ceramic showing little plastic region against a ductile metal showing extensive plastic flow.
Common mistakes and how to put them right
Treating the limit of proportionality and the elastic limit as the same point.
Put it right by noting the elastic limit can lie slightly beyond the limit of proportionality.
Reading the gradient as force divided by extension rather than stress divided by strain.
Put it right by checking the axis labels and units before calculating.
Assuming the whole area under the curve gives the total energy stored rather than energy per unit volume.
Put it right by multiplying by the volume if total energy is required.
Exam tips
- Annotate the curve with labels for limit of proportionality, elastic limit, yield point, ultimate tensile strength and breaking stress before answering.
- When calculating the Young modulus, choose two well-separated points on the straight section and show the substitution with units.
- If asked to compare materials, quote specific features of each curve rather than describing them only in general terms.
Try the lesson
The start of the Bulk properties of solids: Interpretation of simple stress–strain curves. lesson, made from checked teaching notes for this specification point.
Have a go first
On a stress–strain graph for a ductile metal, what does the straight-line region through the origin represent?
Listen
A stress–strain curve plots stress (force per unit cross-sectional area, σ = F/A, in Pa) on the vertical axis against strain (fractional extension, ε = ΔL/L, dimensionless) on the horizontal axis. The initial straight section through the origin shows Hooke's law behaviour, where stress is proportional to strain; its gradient equals the Young modulus E = σ/ε, in Pa. The limit of proportionality is where this straight line ends. A small curved region follows until the elastic limit, beyond which the material no longer returns to its original length. A yield point may appear as a sudden extension at almost constant stress. The maximum is the ultimate tensile strength, and the breaking stress is where fracture occurs. The area under the curve represents energy per unit volume, so a tougher material absorbs more energy before breaking. A strong answer earns marks for these points. Identify the straight-line region through the origin as Hooke's law behaviour and state that its gradient gives the Young modulus E = σ/ε. Locate the limit of proportionality at the end of the straight section and distinguish it from the elastic limit, beyond which permanent deformation occurs. Recognise a yield point as a large extension for little extra stress, typical of a ductile material such as mild steel. Read the ultimate tensile strength from the highest point of the curve and the breaking stress from the point of fracture. A common slip: Treating the limit of proportionality and the elastic limit as the same point. Instead, noting the elastic limit can lie slightly beyond the limit of proportionality. Exam tip: Annotate the curve with labels for limit of proportionality, elastic limit, yield point, ultimate tensile strength and breaking stress before answering.
See it
Put it in order
Put these steps in the order they happen.
- 1. Breaking stress: fracture occurs
- 2. Maximum: ultimate tensile strength
- 3. Small curved region
- 4. Yield point: sudden extension at almost constant stress
- 5. Origin: straight line through origin — Hooke's law; gradient = Young modulus E = σ/ε
- 6. Limit of proportionality: end of straight section
- 7. Elastic limit: beyond this, material no longer returns to original length
Key words
Say what each word means before you turn the card.
Hooke's law behaviour
Try answering aloud or in your head before turning the card.
Young modulus
Try answering aloud or in your head before turning the card.
Elastic limit
Try answering aloud or in your head before turning the card.
Ultimate tensile strength
Try answering aloud or in your head before turning the card.
See every definition
- Hooke's law behaviour
- The initial straight section through the origin of a stress–strain curve, where stress is proportional to strain.
- Young modulus
- The gradient of the straight-line region of a stress–strain curve, equal to stress divided by strain, in Pa.
- Elastic limit
- The point beyond which the material no longer returns to its original length.
- Ultimate tensile strength
- The maximum of the stress–strain curve.
Label the diagram
Some boxes have lost their names. Pick the right name for each number.
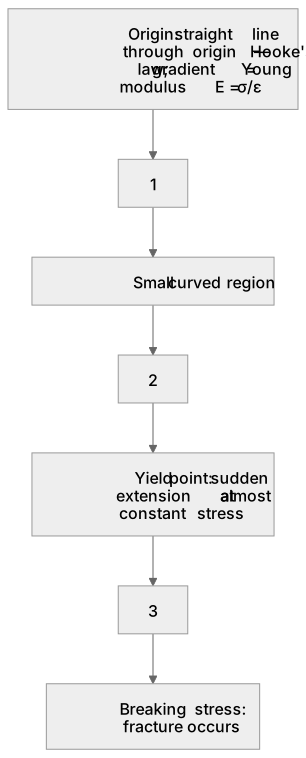
1Box 1
2Box 2
3Box 3
There is more to this lesson
The full lesson goes on to check your understanding and help you earn the marks. Create a free account to carry on, with your progress saved.
A week of Premium from your first lesson · Then the free plan continues · No card, no charge
Test your understanding of Bulk properties of solids: Interpretation of simple stress–strain curves.
Active recall beats re-reading. Take an instant quiz now to test what you’ve learned and lock it into long-term memory.
A week of Premium from your first lesson · Then the free plan continues · No card, no charge