AQA · A-Level · Physics
Course version: 7408 · Version from Sept 2016
Real operational amplifiers (A-level only): Frequency response curve.
A frequency response curve plots the gain of an operational amplifier against the frequency of the input signal, usually on logarithmic axes.
Checked against the AQA 7408 specification (opens in a new tab) on .
- Point 2 of 3
- 4 key terms
Study notes
From the checked teaching notes for this specification point.
The idea
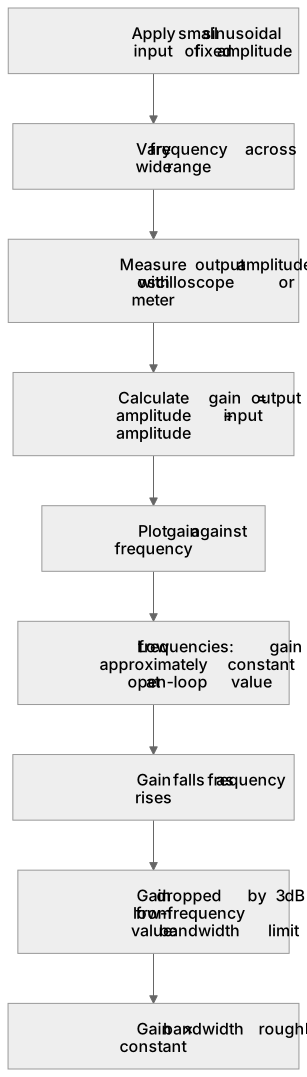
A frequency response curve plots the gain of an operational amplifier against the frequency of the input signal, usually on logarithmic axes. At low frequencies the gain is approximately constant at the open-loop value, then falls as frequency rises. The curve shows where gain has dropped by 3 dB from its low-frequency value; this is the bandwidth limit, and the product of gain and bandwidth is roughly constant. For a real op-amp, stray capacitance and internal compensation cause this roll-off. To obtain the curve, apply a small sinusoidal input of fixed amplitude, vary its frequency across a wide range, and measure the output amplitude with an oscilloscope or meter, calculating gain as output amplitude divided by input amplitude.
What earns the marks
- A frequency response curve shows how voltage gain varies with input signal frequency for a given op-amp configuration.
- At low frequencies the gain is approximately constant and equal to the open-loop or closed-loop value, depending on the circuit.
- As frequency increases, gain falls; the upper limit is often quoted where gain has fallen by 3 dB from its low-frequency value.
- The bandwidth is the range of frequencies over which the gain remains within 3 dB of its maximum, and it is linked to the gain by gain × bandwidth = constant.
- A practical method is to apply a fixed-amplitude sine wave, vary frequency, measure input and output amplitudes, and plot gain against frequency.
- Logarithmic axes or a Bode-style plot make the constant gain region and the roll-off easier to identify.
Common mistakes and how to put them right
Plotting output amplitude rather than gain.
Put it right: Divide output amplitude by input amplitude at each frequency so the curve describes the device rather than the test signal.
Assuming the curve is flat at all frequencies.
Put it right: Recognise the high-frequency roll-off caused by internal capacitance and compensation.
Reading the bandwidth at the point where gain reaches zero.
Put it right: Use the 3 dB reduction point from the low-frequency gain.
Exam tips
- Label both axes with quantity and unit, and state whether gain is a ratio or in decibels.
- When describing a measurement, specify fixed input amplitude, varied frequency, and measurement of both input and output.
- Link the shape of the curve to the gain–bandwidth relationship rather than treating it as an isolated graph.
Try the lesson
The start of the Real operational amplifiers (A-level only): Frequency response curve. lesson, made from checked teaching notes for this specification point.
Have a go first
On a frequency response curve for an operational amplifier, what is plotted on the vertical axis?
Listen
A frequency response curve plots the gain of an operational amplifier against the frequency of the input signal, usually on logarithmic axes. At low frequencies the gain is approximately constant at the open-loop value, then falls as frequency rises. The curve shows where gain has dropped by 3 dB from its low-frequency value; this is the bandwidth limit, and the product of gain and bandwidth is roughly constant. For a real op-amp, stray capacitance and internal compensation cause this roll-off. To obtain the curve, apply a small sinusoidal input of fixed amplitude, vary its frequency across a wide range, and measure the output amplitude with an oscilloscope or meter, calculating gain as output amplitude divided by input amplitude. A strong answer earns marks for these points. A frequency response curve shows how voltage gain varies with input signal frequency for a given op-amp configuration. At low frequencies the gain is approximately constant and equal to the open-loop or closed-loop value, depending on the circuit. As frequency increases, gain falls; the upper limit is often quoted where gain has fallen by 3 dB from its low-frequency value. The bandwidth is the range of frequencies over which the gain remains within 3 dB of its maximum, and it is linked to the gain by gain × bandwidth = constant. A common slip: Plotting output amplitude rather than gain. Instead, divide output amplitude by input amplitude at each frequency so the curve describes the device rather than the test signal. Exam tip: Label both axes with quantity and unit, and state whether gain is a ratio or in decibels.
See it
Key words
Say what each word means before you turn the card.
Frequency response curve
Try answering aloud or in your head before turning the card.
Bandwidth
Try answering aloud or in your head before turning the card.
Gain and bandwidth
Try answering aloud or in your head before turning the card.
Practical measurement and graphing
Try answering aloud or in your head before turning the card.
See every definition
- Frequency response curve
- A plot of the gain of an operational amplifier against the frequency of the input signal, usually on logarithmic axes.
- Bandwidth
- The range of frequencies over which the gain remains within 3 dB of its maximum.
- Gain and bandwidth
- The product of gain and bandwidth is roughly constant.
- Practical measurement and graphing
- Apply a small sinusoidal input of fixed amplitude, vary its frequency across a wide range, and measure the output amplitude with an oscilloscope or meter, calculating gain as output amplitude divided by input amplitude.
Label the diagram
Some boxes have lost their names. Pick the right name for each number.
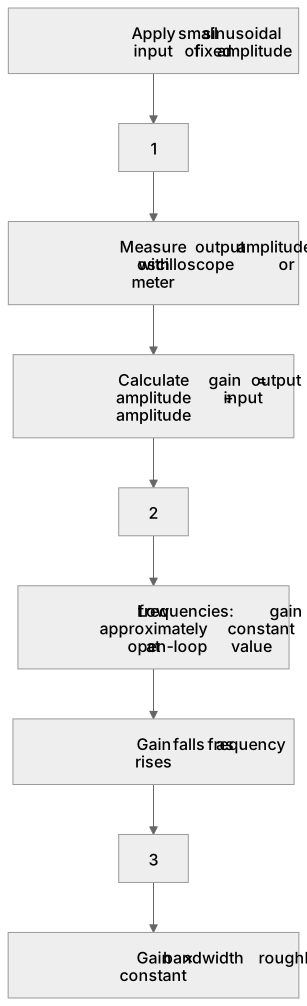
1Box 1
2Box 2
3Box 3
There is more to this lesson
The full lesson goes on to check your understanding and help you earn the marks. Create a free account to carry on, with your progress saved.
A week of Premium from your first lesson · Then the free plan continues · No card, no charge
Test your understanding of Real operational amplifiers (A-level only): Frequency response curve.
Active recall beats re-reading. Take an instant quiz now to test what you’ve learned and lock it into long-term memory.
A week of Premium from your first lesson · Then the free plan continues · No card, no charge