AQA · GCSE · Physics
Course version: 8463 · Version from Sept 2016
Students should be able to draw conclusions from given data about the…
Full specification wording
Properties of electromagnetic waves 2: Students should be able to draw conclusions from given data about the risks and consequences of exposure to radiation.
When evaluating data on radiation exposure, you must draw evidence-based conclusions about risks and consequences.
Checked against the AQA 8463 specification (opens in a new tab) on .
- Point 9 of 11
- 4 key terms
Study notes
From the checked teaching notes for this specification point.
The idea
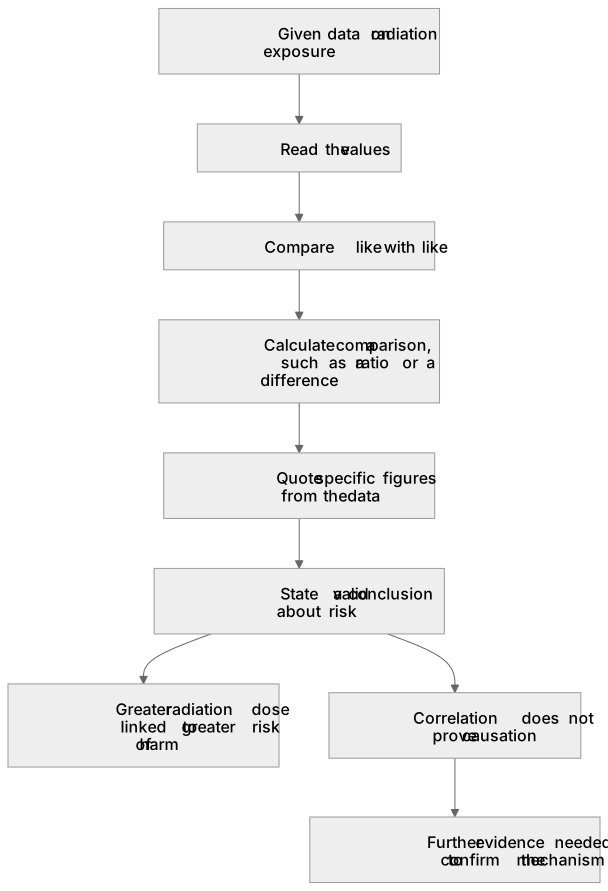
When evaluating data on radiation exposure, you must draw evidence-based conclusions about risks and consequences. Exam questions often provide a table or graph, such as radiation doses from medical scans versus background sources. Read the values, compare like with like, and state a conclusion supported by the data. For example, if a table shows a dental X-ray gives 0.005 mSv and a CT scan gives 10.0 mSv, conclude the CT scan carries a higher risk of cellular damage by calculating the ratio. Always quote specific figures from the provided data to justify your reasoning. Remember that correlation does not automatically prove causation; data might show a link, but further evidence is needed to confirm the exact mechanism causing the harm.
What earns the marks
- Quoting relevant figures from the data provided to support a conclusion.
- Calculating a comparison, such as a ratio or a difference between two radiation doses.
- Stating a valid conclusion about risk that logically follows from the provided figures.
- Linking a greater radiation dose to a greater risk of harm, such as cellular damage or cancer.
Common mistakes and how to put them right
Writing a conclusion from memory without using any of the numbers supplied, corrected by always quoting data from the source.
Describing the trend but never answering the specific question asked, corrected by explicitly addressing the prompt's focus on risk.
Claiming a cause from a correlation with no further evidence, corrected by stating the data only shows a relationship or link.
Exam tips
- Quote at least one specific number or calculated difference from the data in every conclusion you write.
- State clearly which comparison you are making before you make it, for example comparing annual background dose against a single medical scan.
Try the lesson
The start of the Properties of electromagnetic waves 2: Students should be able to draw conclusions from given data about the risks and consequences of exposure to radiation. lesson, made from checked teaching notes for this specification point.
Have a go first
A medical study monitors two groups of people. Group A received a radiation dose of 10 mSv and Group B received a radiation dose of 100 mSv. The study found that a larger percentage of people in Group B developed cancer compared to Group A. What is the most valid conclusion that can be drawn from this data?
Listen
When evaluating data on radiation exposure, you must draw evidence-based conclusions about risks and consequences. Exam questions often provide a table or graph, such as radiation doses from medical scans versus background sources. Read the values, compare like with like, and state a conclusion supported by the data. For example, if a table shows a dental X-ray gives 0.005 mSv and a CT scan gives 10.0 mSv, conclude the CT scan carries a higher risk of cellular damage by calculating the ratio. Always quote specific figures from the provided data to justify your reasoning. Remember that correlation does not automatically prove causation; data might show a link, but further evidence is needed to confirm the exact mechanism causing the harm. A strong answer earns marks for these points. quoting relevant figures from the data provided to support a conclusion. calculating a comparison, such as a ratio or a difference between two radiation doses. stating a valid conclusion about risk that logically follows from the provided figures. linking a greater radiation dose to a greater risk of harm, such as cellular damage or cancer. Exam tip: Quote at least one specific number or calculated difference from the data in every conclusion you write.
See it
Key words
Say what each word means before you turn the card.
interpreting data
Try answering aloud or in your head before turning the card.
quoting figures
Try answering aloud or in your head before turning the card.
risk comparison
Try answering aloud or in your head before turning the card.
correlation and causation
Try answering aloud or in your head before turning the card.
See every definition
- interpreting data
- Reading the values from a table or graph and stating a conclusion supported by the data.
- quoting figures
- Using specific numbers from the provided data to justify your reasoning in a conclusion.
- risk comparison
- Calculating a comparison, such as a ratio or a difference, between two radiation doses to conclude which carries a higher risk.
- correlation and causation
- A link shown in data does not automatically prove that the radiation caused the observed harm, so further evidence is needed to confirm the exact mechanism.
Label the diagram
Some boxes have lost their names. Pick the right name for each number.
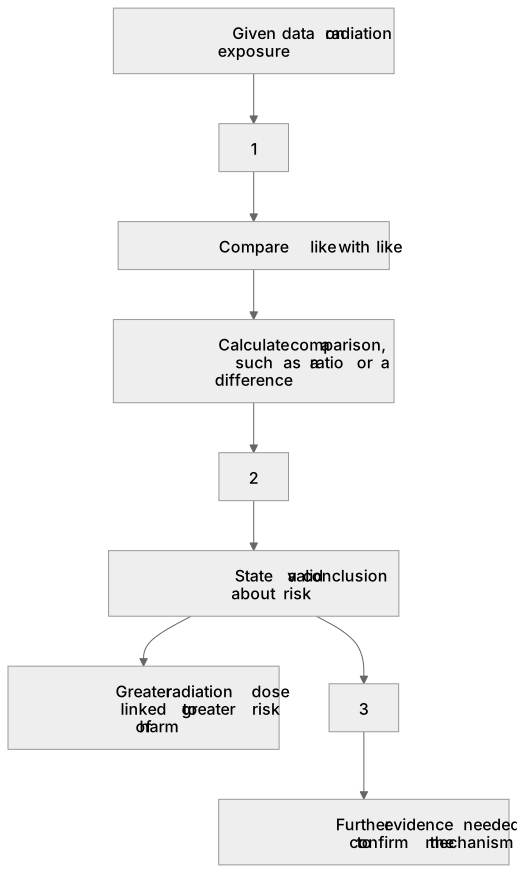
1Box 1
2Box 2
3Box 3
There is more to this lesson
The full lesson goes on to check your understanding and help you earn the marks. Create a free account to carry on, with your progress saved.
A week of Premium from your first lesson · Then the free plan continues · No card, no charge
Test your understanding of Properties of electromagnetic waves 2: Students should be able to draw conclusions from given data about the risks and consequences of exposure to radiation.
Active recall beats re-reading. Take an instant quiz now to test what you’ve learned and lock it into long-term memory.
A week of Premium from your first lesson · Then the free plan continues · No card, no charge