AQA · GCSE · Physics
Course version: 8463 · Version from Sept 2016
The speed of an object can be calculated from the gradient of its…
Full specification wording
The distance–time relationship: The speed of an object can be calculated from the gradient of its distance–time graph.
Speed is distance divided by time, and that is exactly what a gradient is on this graph, so the two are the same calculation.
Checked against the AQA 8463 specification (opens in a new tab) on .
- Point 2 of 5
Study notes
From the checked teaching notes for this specification point.
The idea
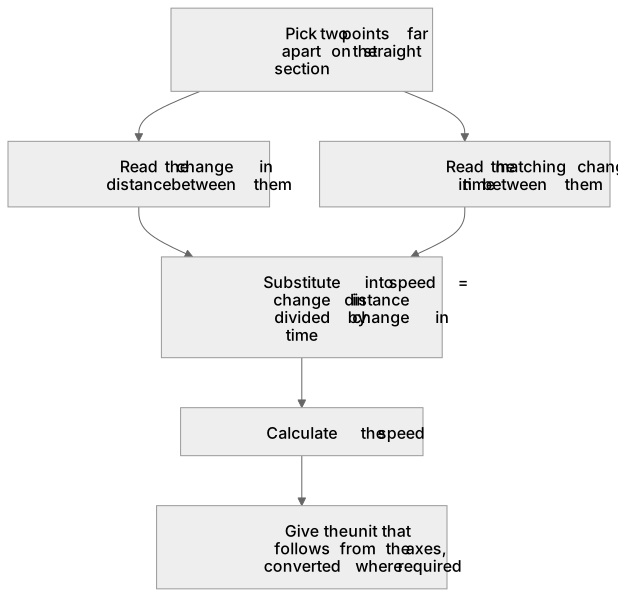
Speed is distance divided by time, and that is exactly what a gradient is on this graph, so the two are the same calculation. Pick two points far apart on the straight section, because a large triangle reduces the effect of reading error, and take the change in distance together with the change in time between them. A telescope's graph showing 38 km covered in 5.0 s gives a speed of 7.6 km/s. Mark schemes award one mark for reading a correct pair of changes, one for the substitution and one for the answer, so show all three steps. Read the axis units before dividing, because a vertical axis in kilometres and a horizontal axis in seconds give an answer in kilometres per second unless you convert first.
What earns the marks
- Reading a correct change in distance with the matching change in time.
- A correct substitution into speed = change in distance divided by change in time.
- The correctly calculated speed.
- The unit that follows from the axes, converted where the question requires it.
Common mistakes and how to put them right
Dividing a single pair of coordinates rather than using the changes.
Using a small triangle, so that reading errors dominate the answer.
Taking a gradient across a curved section as though it were straight.
Ignoring an axis marked in kilometres or in minutes.
Exam tips
- Draw the triangle on the graph itself; examiners give credit for the working shown there.
- Choose points where the line crosses grid lines exactly so the readings are easy.
Try the lesson
The start of the The distance–time relationship: The speed of an object can be calculated from the gradient of its distance–time graph. lesson, made from checked teaching notes for this specification point.
Have a go first
What does the gradient of a distance–time graph represent?
Listen
Speed is distance divided by time, and that is exactly what a gradient is on this graph, so the two are the same calculation. Pick two points far apart on the straight section, because a large triangle reduces the effect of reading error, and take the change in distance together with the change in time between them. A telescope's graph showing 38 km covered in 5.0 s gives a speed of 7.6 km/s. Mark schemes award one mark for reading a correct pair of changes, one for the substitution and one for the answer, so show all three steps. Read the axis units before dividing, because a vertical axis in kilometres and a horizontal axis in seconds give an answer in kilometres per second unless you convert first. A strong answer earns marks for these points. reading a correct change in distance with the matching change in time. a correct substitution into speed = change in distance divided by change in time. the correctly calculated speed. the unit that follows from the axes, converted where the question requires it. Exam tip: Draw the triangle on the graph itself; examiners give credit for the working shown there.
See it
Label the diagram
Some boxes have lost their names. Pick the right name for each number.
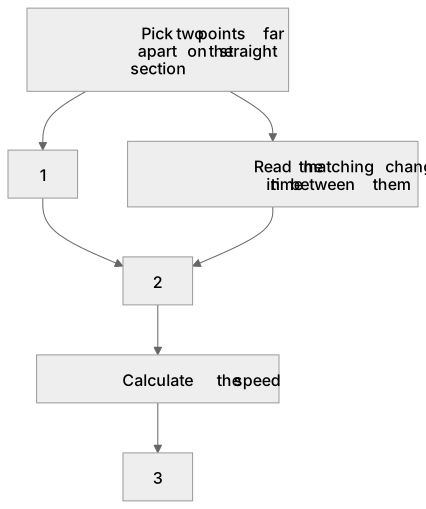
1Box 1
2Box 2
3Box 3
There is more to this lesson
The full lesson goes on to check your understanding and help you earn the marks. Create a free account to carry on, with your progress saved.
A week of Premium from your first lesson · Then the free plan continues · No card, no charge
Test your understanding of The distance–time relationship: The speed of an object can be calculated from the gradient of its distance–time graph.
Active recall beats re-reading. Take an instant quiz now to test what you’ve learned and lock it into long-term memory.
A week of Premium from your first lesson · Then the free plan continues · No card, no charge