OCR · A-Level · Physics
Course version: H556 · Version from Sept 2015
(b) use of appropriate mathematical skills for analysis of quantitative data
Full specification wording
Analysis: (b) use of appropriate mathematical skills for analysis of quantitative data
Analysing quantitative data needs the right mathematical tool for the job.
Checked against the OCR H556 specification (opens in a new tab) on .
- Point 1 of 5
- 4 key terms
Study notes
From the checked teaching notes for this specification point.
The idea
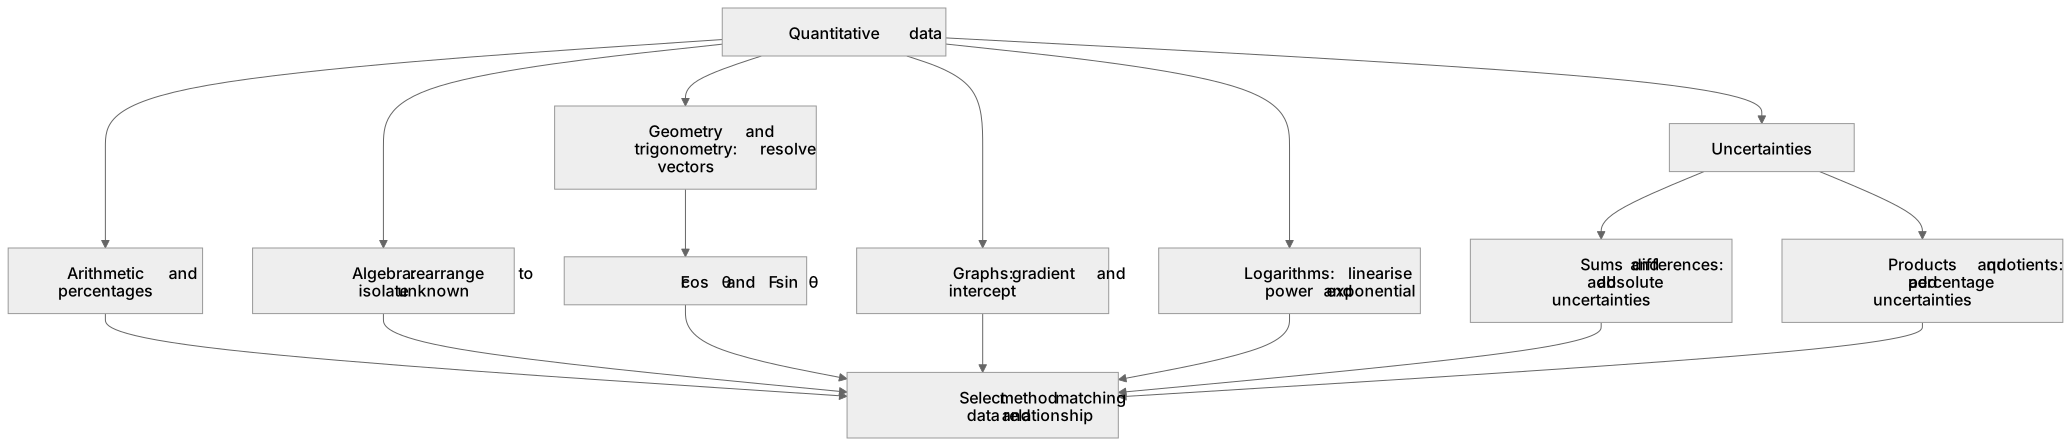
Analysing quantitative data needs the right mathematical tool for the job. Arithmetic and percentages handle averages and percentage differences; algebra rearranges equations such as v = u + at to isolate an unknown; geometry and trigonometry resolve vectors, so a force F at angle θ has components F cos θ and F sin θ. Graphs turn equations into straight lines: plotting y against x gives gradient m and intercept c for y = mx + c, while logarithms linearise power and exponential relationships. Uncertainties combine by adding absolute uncertainties for sums and differences, and adding percentage uncertainties for products and quotients. In a multiple-choice question you select the method that matches the data and the relationship being tested.
What earns the marks
- Rearrange an equation algebraically to make the required quantity the subject before substituting values.
- Resolve a vector into perpendicular components using F cos θ and F sin θ.
- Use a straight-line graph to find a gradient or intercept and relate it to constants in the equation.
- Apply logarithms to linearise a power or exponential relationship where needed.
- Combine uncertainties correctly, adding absolute uncertainties for sums and percentage uncertainties for products and quotients.
- Carry units and significant figures consistently through the calculation to the final answer.
Common mistakes and how to put them right
Substituting numbers before rearranging the equation.
Put it right: Rearrange symbolically first, then substitute.
Swapping sine and cosine when resolving a vector.
Put it right: Check which component is adjacent to the angle and use cosine for it.
Adding percentage uncertainties when multiplying quantities but adding absolute uncertainties when adding them.
Put it right: Match the rule to the operation.
Exam tips
- Write the rearranged equation before substituting, so an arithmetic slip does not hide a correct method.
- Sketch the vector triangle or graph to check which trigonometric ratio or gradient you need.
- Estimate the answer first, then compare it with the calculated value to catch factor-of-ten errors.
Try the lesson
The start of the Analysis: (b) use of appropriate mathematical skills for analysis of quantitative data lesson, made from checked teaching notes for this specification point.
Listen
Analysing quantitative data needs the right mathematical tool for the job. Arithmetic and percentages handle averages and percentage differences; algebra rearranges equations such as v = u + at to isolate an unknown; geometry and trigonometry resolve vectors, so a force F at angle θ has components F cos θ and F sin θ. Graphs turn equations into straight lines: plotting y against x gives gradient m and intercept c for y = mx + c, while logarithms linearise power and exponential relationships. Uncertainties combine by adding absolute uncertainties for sums and differences, and adding percentage uncertainties for products and quotients. In a multiple-choice question you select the method that matches the data and the relationship being tested. A strong answer earns marks for these points. Rearrange an equation algebraically to make the required quantity the subject before substituting values. Resolve a vector into perpendicular components using F cos θ and F sin θ. Use a straight-line graph to find a gradient or intercept and relate it to constants in the equation. Apply logarithms to linearise a power or exponential relationship where needed. A common slip: Substituting numbers before rearranging the equation. Instead, rearrange symbolically first, then substitute. Exam tip: Write the rearranged equation before substituting, so an arithmetic slip does not hide a correct method.
See it
Key words
Say what each word means before you turn the card.
Algebraic rearrangement of equations
Try answering aloud or in your head before turning the card.
Vector resolution with trigonometry
Try answering aloud or in your head before turning the card.
Graph gradients, intercepts and linearisation
Try answering aloud or in your head before turning the card.
Combining uncertainties in calculations
Try answering aloud or in your head before turning the card.
See every definition
- Algebraic rearrangement of equations
- Rearranging an equation such as v = u + at to isolate an unknown before substituting values.
- Vector resolution with trigonometry
- Resolving a vector into perpendicular components, so a force F at angle θ has components F cos θ and F sin θ.
- Graph gradients, intercepts and linearisation
- Plotting y against x gives gradient m and intercept c for y = mx + c, while logarithms linearise power and exponential relationships.
- Combining uncertainties in calculations
- Adding absolute uncertainties for sums and differences, and adding percentage uncertainties for products and quotients.
Label the diagram
Some boxes have lost their names. Pick the right name for each number.
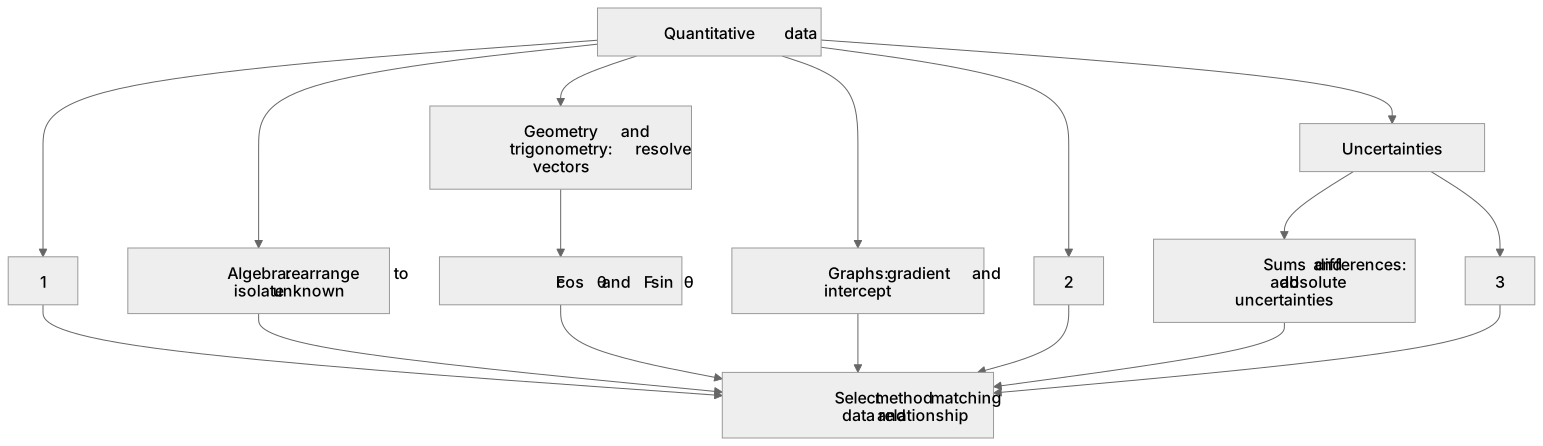
1Box 1
2Box 2
3Box 3
There is more to this lesson
The full lesson goes on to check your understanding and help you earn the marks. Create a free account to carry on, with your progress saved.
A week of Premium from your first lesson · Then the free plan continues · No card, no charge
Test your understanding of Analysis: (b) use of appropriate mathematical skills for analysis of quantitative data
Active recall beats re-reading. Take an instant quiz now to test what you’ve learned and lock it into long-term memory.
A week of Premium from your first lesson · Then the free plan continues · No card, no charge