OCR · A-Level · Physics
Course version: H556 · Version from Sept 2015
(d) plotting and interpreting suitable graphs from experimental results,…
Full specification wording
Analysis: (d) plotting and interpreting suitable graphs from experimental results, including
Plotting and interpreting suitable graphs is essential for analysing experimental results.
Checked against the OCR H556 specification (opens in a new tab) on .
- Point 3 of 5
Study notes
From the checked teaching notes for this specification point.
The idea
Plotting and interpreting suitable graphs is essential for analysing experimental results. A graph has the independent variable on the x-axis and dependent variable on the y-axis, with axes labelled with quantities and units. The scale must allow data to occupy at least half of each axis, with points plotted accurately. A line or curve of best fit shows the trend. Interpreting involves identifying the shape, determining gradients and intercepts, and relating these to physical quantities.
For example: A graph of force against extension for a spring yields a straight line; the gradient gives the spring constant $k$.
What earns the marks
- Identify the independent variable (x-axis) and dependent variable (y-axis) from the experimental context.
- Label axes with the correct quantity and unit, e.g. 'Time / s' or 'Current / A'.
- Choose a scale that uses at least half of the available axis length and allows all data points to be plotted.
- Plot points accurately and draw a line or curve of best fit.
- Interpret the graph by determining the gradient and intercept, and relate these to the physical relationship.
Common mistakes and how to put them right
Misunderstanding: the independent variable should be on the y-axis.
Put it right: The independent variable is conventionally plotted on the x-axis.
Misunderstanding: axes need only be labelled with the quantity name, not the unit.
Put it right: Axes must be labelled with both quantity and unit, e.g. 'Force / N'.
Misunderstanding: the scale should start at zero always.
Put it right: The scale should be chosen to make best use of the graph paper; it need not start at zero if the data range does not include zero.
Misunderstanding: a line of best fit must pass through every data point.
Put it right: A line of best fit should be a smooth line or curve that shows the overall trend, not necessarily passing through all points.
Exam tips
- Check that the axes are labelled with the correct quantity and unit before considering the shape of the graph.
- Ensure the scale is linear and easy to read; avoid awkward scales such as 3 units per major division.
- When interpreting, consider what the gradient and intercept represent in terms of the physical quantities.
- Look for whether the graph should pass through the origin based on the theoretical relationship.
Try the lesson
The start of the Analysis: (d) plotting and interpreting suitable graphs from experimental results, including lesson, made from checked teaching notes for this specification point.
Listen
Plotting and interpreting suitable graphs is essential for analysing experimental results. A graph has the independent variable on the x-axis and dependent variable on the y-axis, with axes labelled with quantities and units. The scale must allow data to occupy at least half of each axis, with points plotted accurately. A line or curve of best fit shows the trend. Interpreting involves identifying the shape, determining gradients and intercepts, and relating these to physical quantities. For example, a graph of force against extension for a spring yields a straight line; the gradient gives the spring constant k. A strong answer earns marks for these points. Identify the independent variable (x-axis) and dependent variable (y-axis) from the experimental context. Label axes with the correct quantity and unit, e.g. 'Time / s' or 'Current / A'. Choose a scale that uses at least half of the available axis length and allows all data points to be plotted. Plot points accurately and draw a line or curve of best fit. A common slip: Misunderstanding: the independent variable should be on the y-axis. Instead, the independent variable is conventionally plotted on the x-axis. Exam tip: Check that the axes are labelled with the correct quantity and unit before considering the shape of the graph.
See it
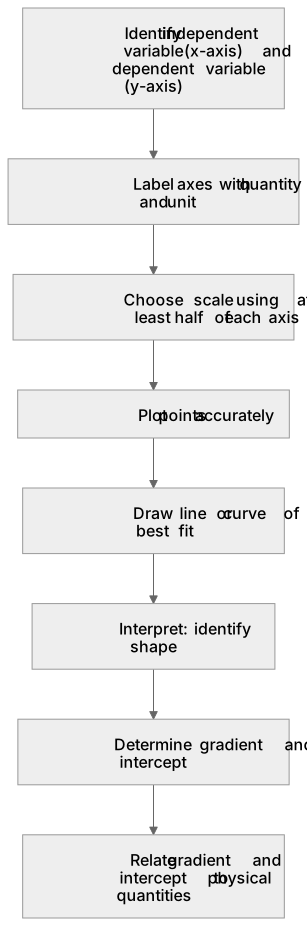
Put it in order
Put these steps in the order they happen.
- 1. Draw line or curve of best fit
- 2. Relate gradient and intercept to physical quantities
- 3. Interpret: identify shape
- 4. Identify independent variable (x-axis) and dependent variable (y-axis)
- 5. Label axes with quantity and unit
- 6. Determine gradient and intercept
- 7. Choose scale using at least half of each axis
- 8. Plot points accurately
Label the diagram
Some boxes have lost their names. Pick the right name for each number.
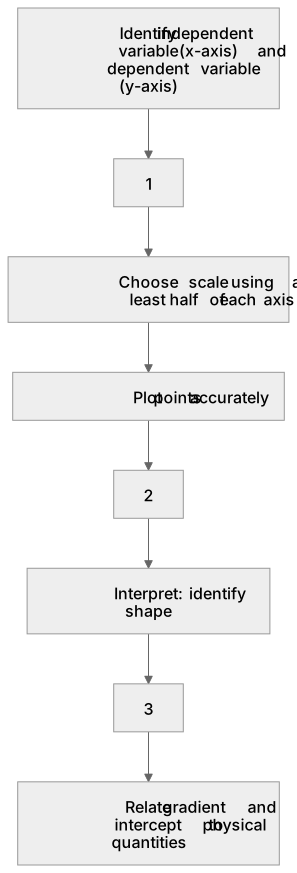
1Box 1
2Box 2
3Box 3
There is more to this lesson
The full lesson goes on to check your understanding and help you earn the marks. Create a free account to carry on, with your progress saved.
A week of Premium from your first lesson · Then the free plan continues · No card, no charge
Test your understanding of Analysis: (d) plotting and interpreting suitable graphs from experimental results, including
Active recall beats re-reading. Take an instant quiz now to test what you’ve learned and lock it into long-term memory.
A week of Premium from your first lesson · Then the free plan continues · No card, no charge