OCR · A-Level · Physics
Course version: H556 · Version from Sept 2015
(g) Hertzsprung–Russell (HR) diagram as luminosity- temperature plot; main…
Full specification wording
Stars: (g) Hertzsprung–Russell (HR) diagram as luminosity- temperature plot; main sequence; red giants; super red giants; white dwarfs.
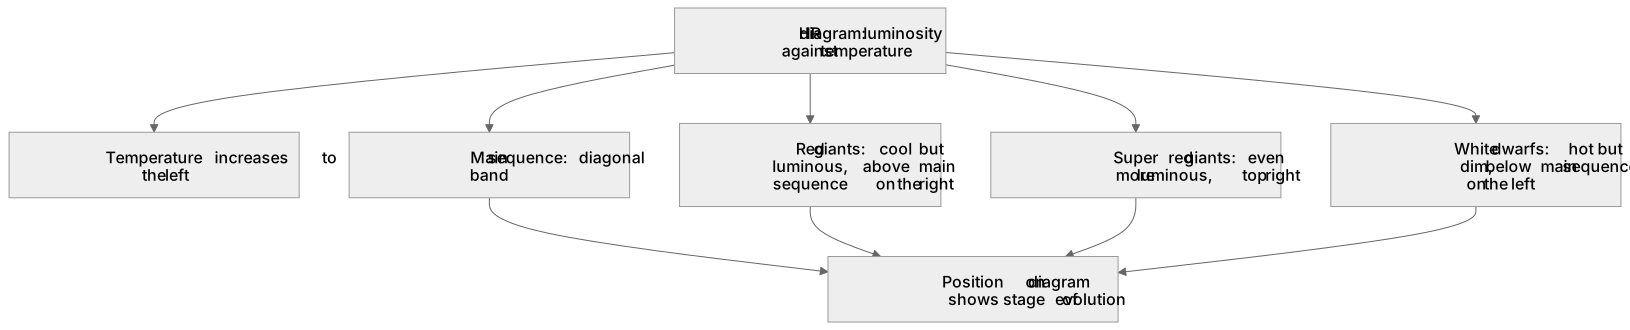
An HR diagram plots luminosity on the vertical axis against temperature on the horizontal axis, with temperature increasing towards the left.
Checked against the OCR H556 specification (opens in a new tab) on .
- Point 7 of 7
- 4 key terms
Study notes
From the checked teaching notes for this specification point.
The idea
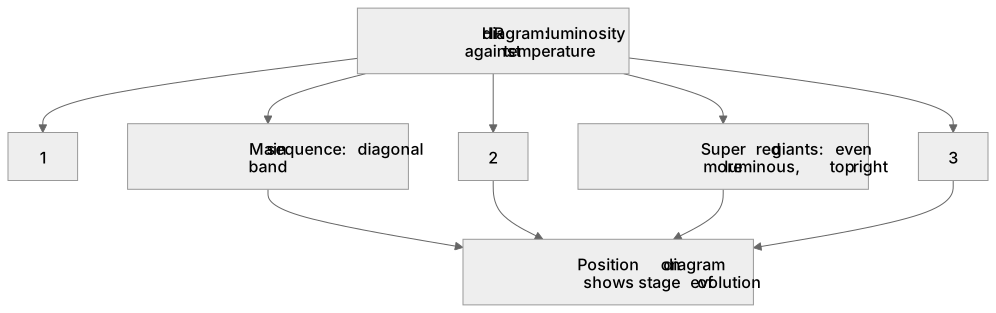
An HR diagram plots luminosity on the vertical axis against temperature on the horizontal axis, with temperature increasing towards the left. Stars do not scatter randomly but group into regions. Most stars, including the Sun, lie on the main sequence, a diagonal band from hot, luminous stars to cool, dim ones. Red giants are cool but luminous, so they sit above the main sequence on the right. Super red giants are even more luminous and occupy the top right. White dwarfs are hot but dim, so they lie below the main sequence on the left. The position of a star on the diagram therefore tells you about its stage of evolution.
What earns the marks
- An HR diagram plots luminosity against temperature, with temperature increasing to the left.
- The main sequence is a diagonal band containing stars that fuse hydrogen in their cores.
- Red giants and super red giants are cool but highly luminous and lie above the main sequence.
- White dwarfs are hot but dim and lie below the main sequence.
Common mistakes and how to put them right
Plotting temperature increasing to the right.
Put it right: On a standard HR diagram it increases to the left.
Placing red giants on the main sequence.
Put it right: They are cool but luminous, so they lie above it.
Thinking white dwarfs are cool.
Put it right: They are hot but have low luminosity because they are very small.
Exam tips
- Sketch the main sequence, red giant region, super red giant region and white dwarf region before answering.
- Check the direction of the temperature axis every time you read an HR diagram.
- Use luminosity and temperature together to justify the position of a star.
Try the lesson
The start of the Stars: (g) Hertzsprung–Russell (HR) diagram as luminosity- temperature plot; main sequence; red giants; super red giants; white dwarfs. lesson, made from checked teaching notes for this specification point.
Listen
An HR diagram plots luminosity on the vertical axis against temperature on the horizontal axis, with temperature increasing towards the left. Stars do not scatter randomly but group into regions. Most stars, including the Sun, lie on the main sequence, a diagonal band from hot, luminous stars to cool, dim ones. Red giants are cool but luminous, so they sit above the main sequence on the right. Super red giants are even more luminous and occupy the top right. White dwarfs are hot but dim, so they lie below the main sequence on the left. The position of a star on the diagram therefore tells you about its stage of evolution. A strong answer earns marks for these points. An HR diagram plots luminosity against temperature, with temperature increasing to the left. The main sequence is a diagonal band containing stars that fuse hydrogen in their cores. Red giants and super red giants are cool but highly luminous and lie above the main sequence. White dwarfs are hot but dim and lie below the main sequence. Exam tip: Sketch the main sequence, red giant region, super red giant region and white dwarf region before answering.
See it
Key words
Say what each word means before you turn the card.
HR diagram
Try answering aloud or in your head before turning the card.
Main sequence
Try answering aloud or in your head before turning the card.
Red giants
Try answering aloud or in your head before turning the card.
White dwarfs
Try answering aloud or in your head before turning the card.
See every definition
- HR diagram
- A plot of luminosity on the vertical axis against temperature on the horizontal axis, with temperature increasing towards the left.
- Main sequence
- A diagonal band from hot, luminous stars to cool, dim ones, containing stars that fuse hydrogen in their cores.
- Red giants
- Cool but luminous stars that sit above the main sequence on the right.
- White dwarfs
- Hot but dim stars that lie below the main sequence on the left.
Label the diagram
Some boxes have lost their names. Pick the right name for each number.
1Box 1
2Box 2
3Box 3
There is more to this lesson
The full lesson goes on to check your understanding and help you earn the marks. Create a free account to carry on, with your progress saved.
A week of Premium from your first lesson · Then the free plan continues · No card, no charge
Test your understanding of Stars: (g) Hertzsprung–Russell (HR) diagram as luminosity- temperature plot; main sequence; red giants; super red giants; white dwarfs.
Active recall beats re-reading. Take an instant quiz now to test what you’ve learned and lock it into long-term memory.
A week of Premium from your first lesson · Then the free plan continues · No card, no charge