Speed — OCR GCSE Study Guide
Exam Board: OCR | Level: GCSE
Master the essentials of Speed for your OCR GCSE Physics exam. This guide breaks down the core formula, distance-time graphs, and the crucial difference between average and instantaneous speed, ensuring you can secure every mark.
## Overview
Welcome to your definitive guide for OCR GCSE Physics, Topic 1.3: Speed. This fundamental concept describes how quickly an object moves and is a cornerstone of mechanics. In your exam, you'll face questions that require you to calculate speed, distance, or time, interpret distance-time graphs, and recall typical speeds of everyday phenomena. A solid understanding here is vital as it provides the foundation for more complex topics like acceleration, forces (P2), and momentum (P3). Examiners frequently test speed in a variety of contexts, from simple calculations to multi-step problems involving journeys with different stages. This guide will equip you with the knowledge and exam technique to tackle them all with confidence.

## Key Concepts
### Concept 1: Defining and Calculating Speed
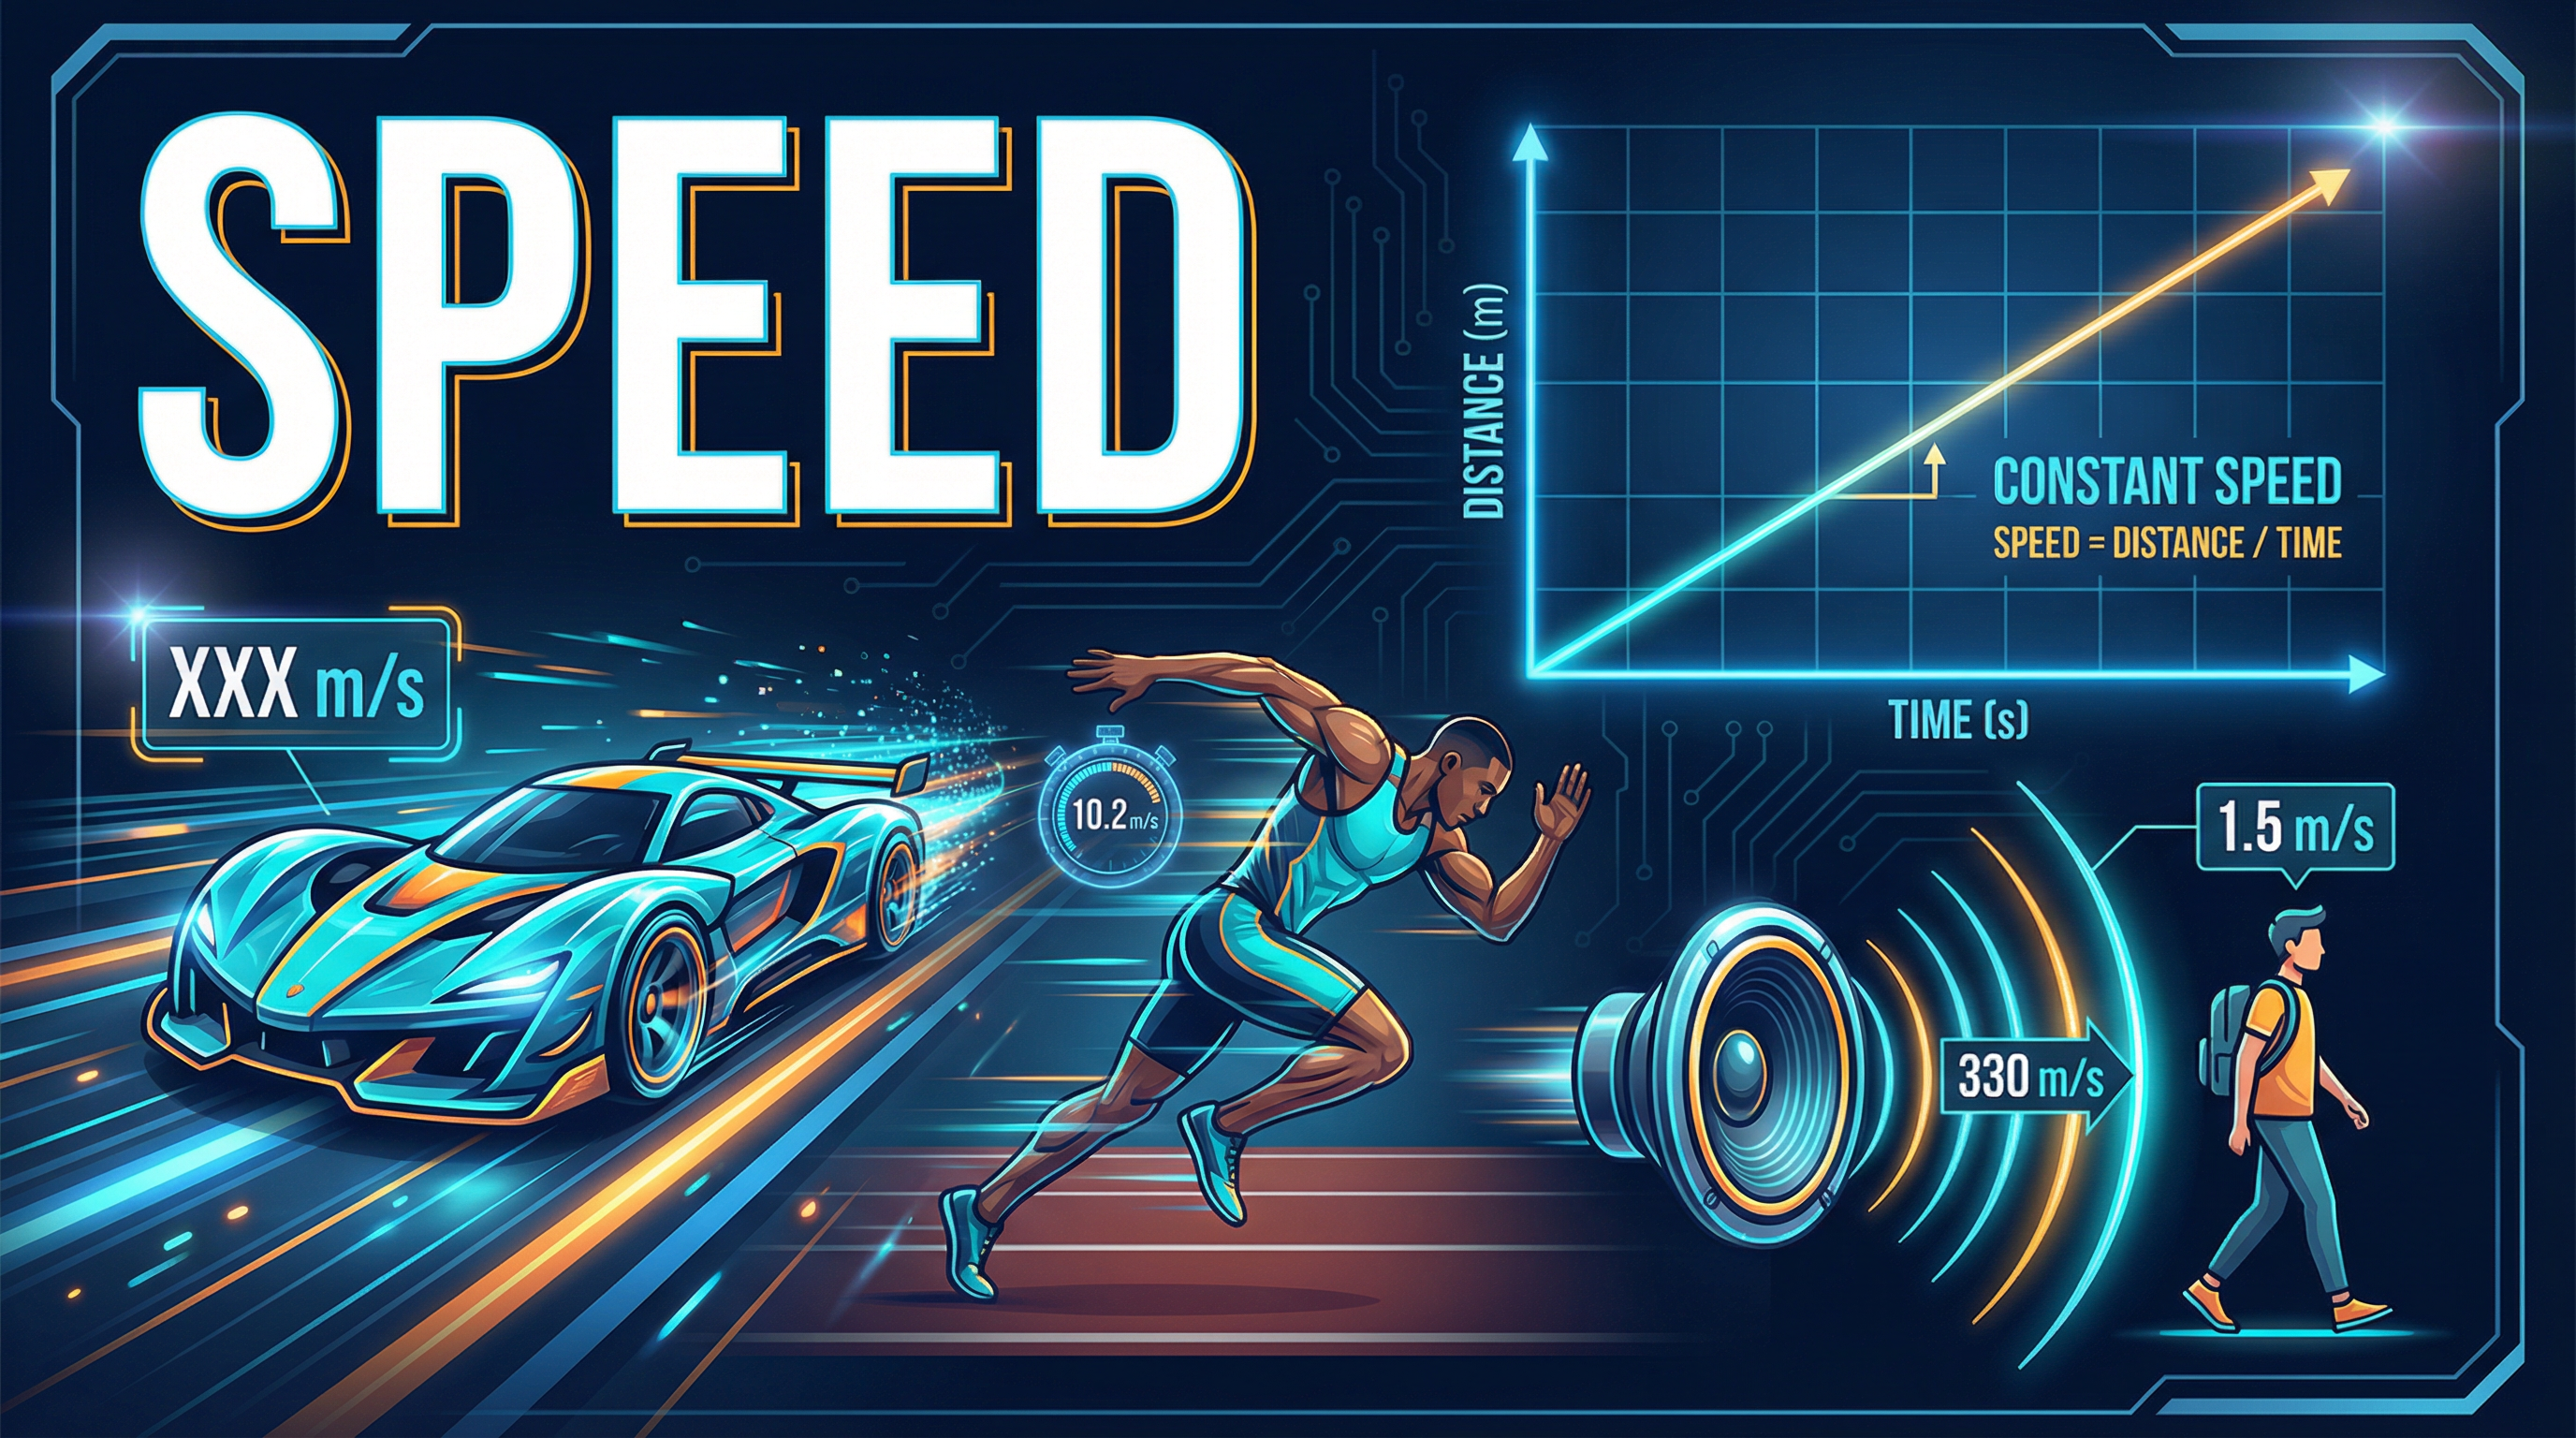
Speed is a **scalar quantity** that measures the rate at which an object covers distance. This means it has a magnitude (a size, e.g., 10 m/s) but no direction. The core relationship, which you **must memorise**, is:
**Speed = Distance / Time**
This formula is the key to a huge number of marks. It allows you to calculate not just speed, but also distance or time if you rearrange it. Examiners expect you to be fluent in its use and to apply it to various scenarios.
**Example**: A sprinter runs 100 m in 9.58 seconds. To find their average speed, you would calculate:
Speed = 100 m / 9.58 s = 10.44 m/s. Credit is given for showing the formula, the substitution, and the final answer with the correct units.
### Concept 2: Average vs. Instantaneous Speed
It's crucial to distinguish between these two terms. **Average speed** is calculated over an entire journey, using the total distance travelled divided by the total time taken. It smooths out any variations, like speeding up, slowing down, or stopping.
**Instantaneous speed** is the speed at a single moment in time. It's what a car's speedometer shows. For an object moving at a constant speed, its average and instantaneous speeds are the same. However, for most journeys, the speed changes. For example, a bus journey involves stopping and starting, so its instantaneous speed is often zero, but its average speed over the whole route might be 15 km/h.
### Concept 3: Distance-Time Graphs
Distance-time graphs are a powerful visual tool for representing motion, and a favourite of examiners. The y-axis represents the total distance travelled from the start point, and the x-axis represents the time taken.
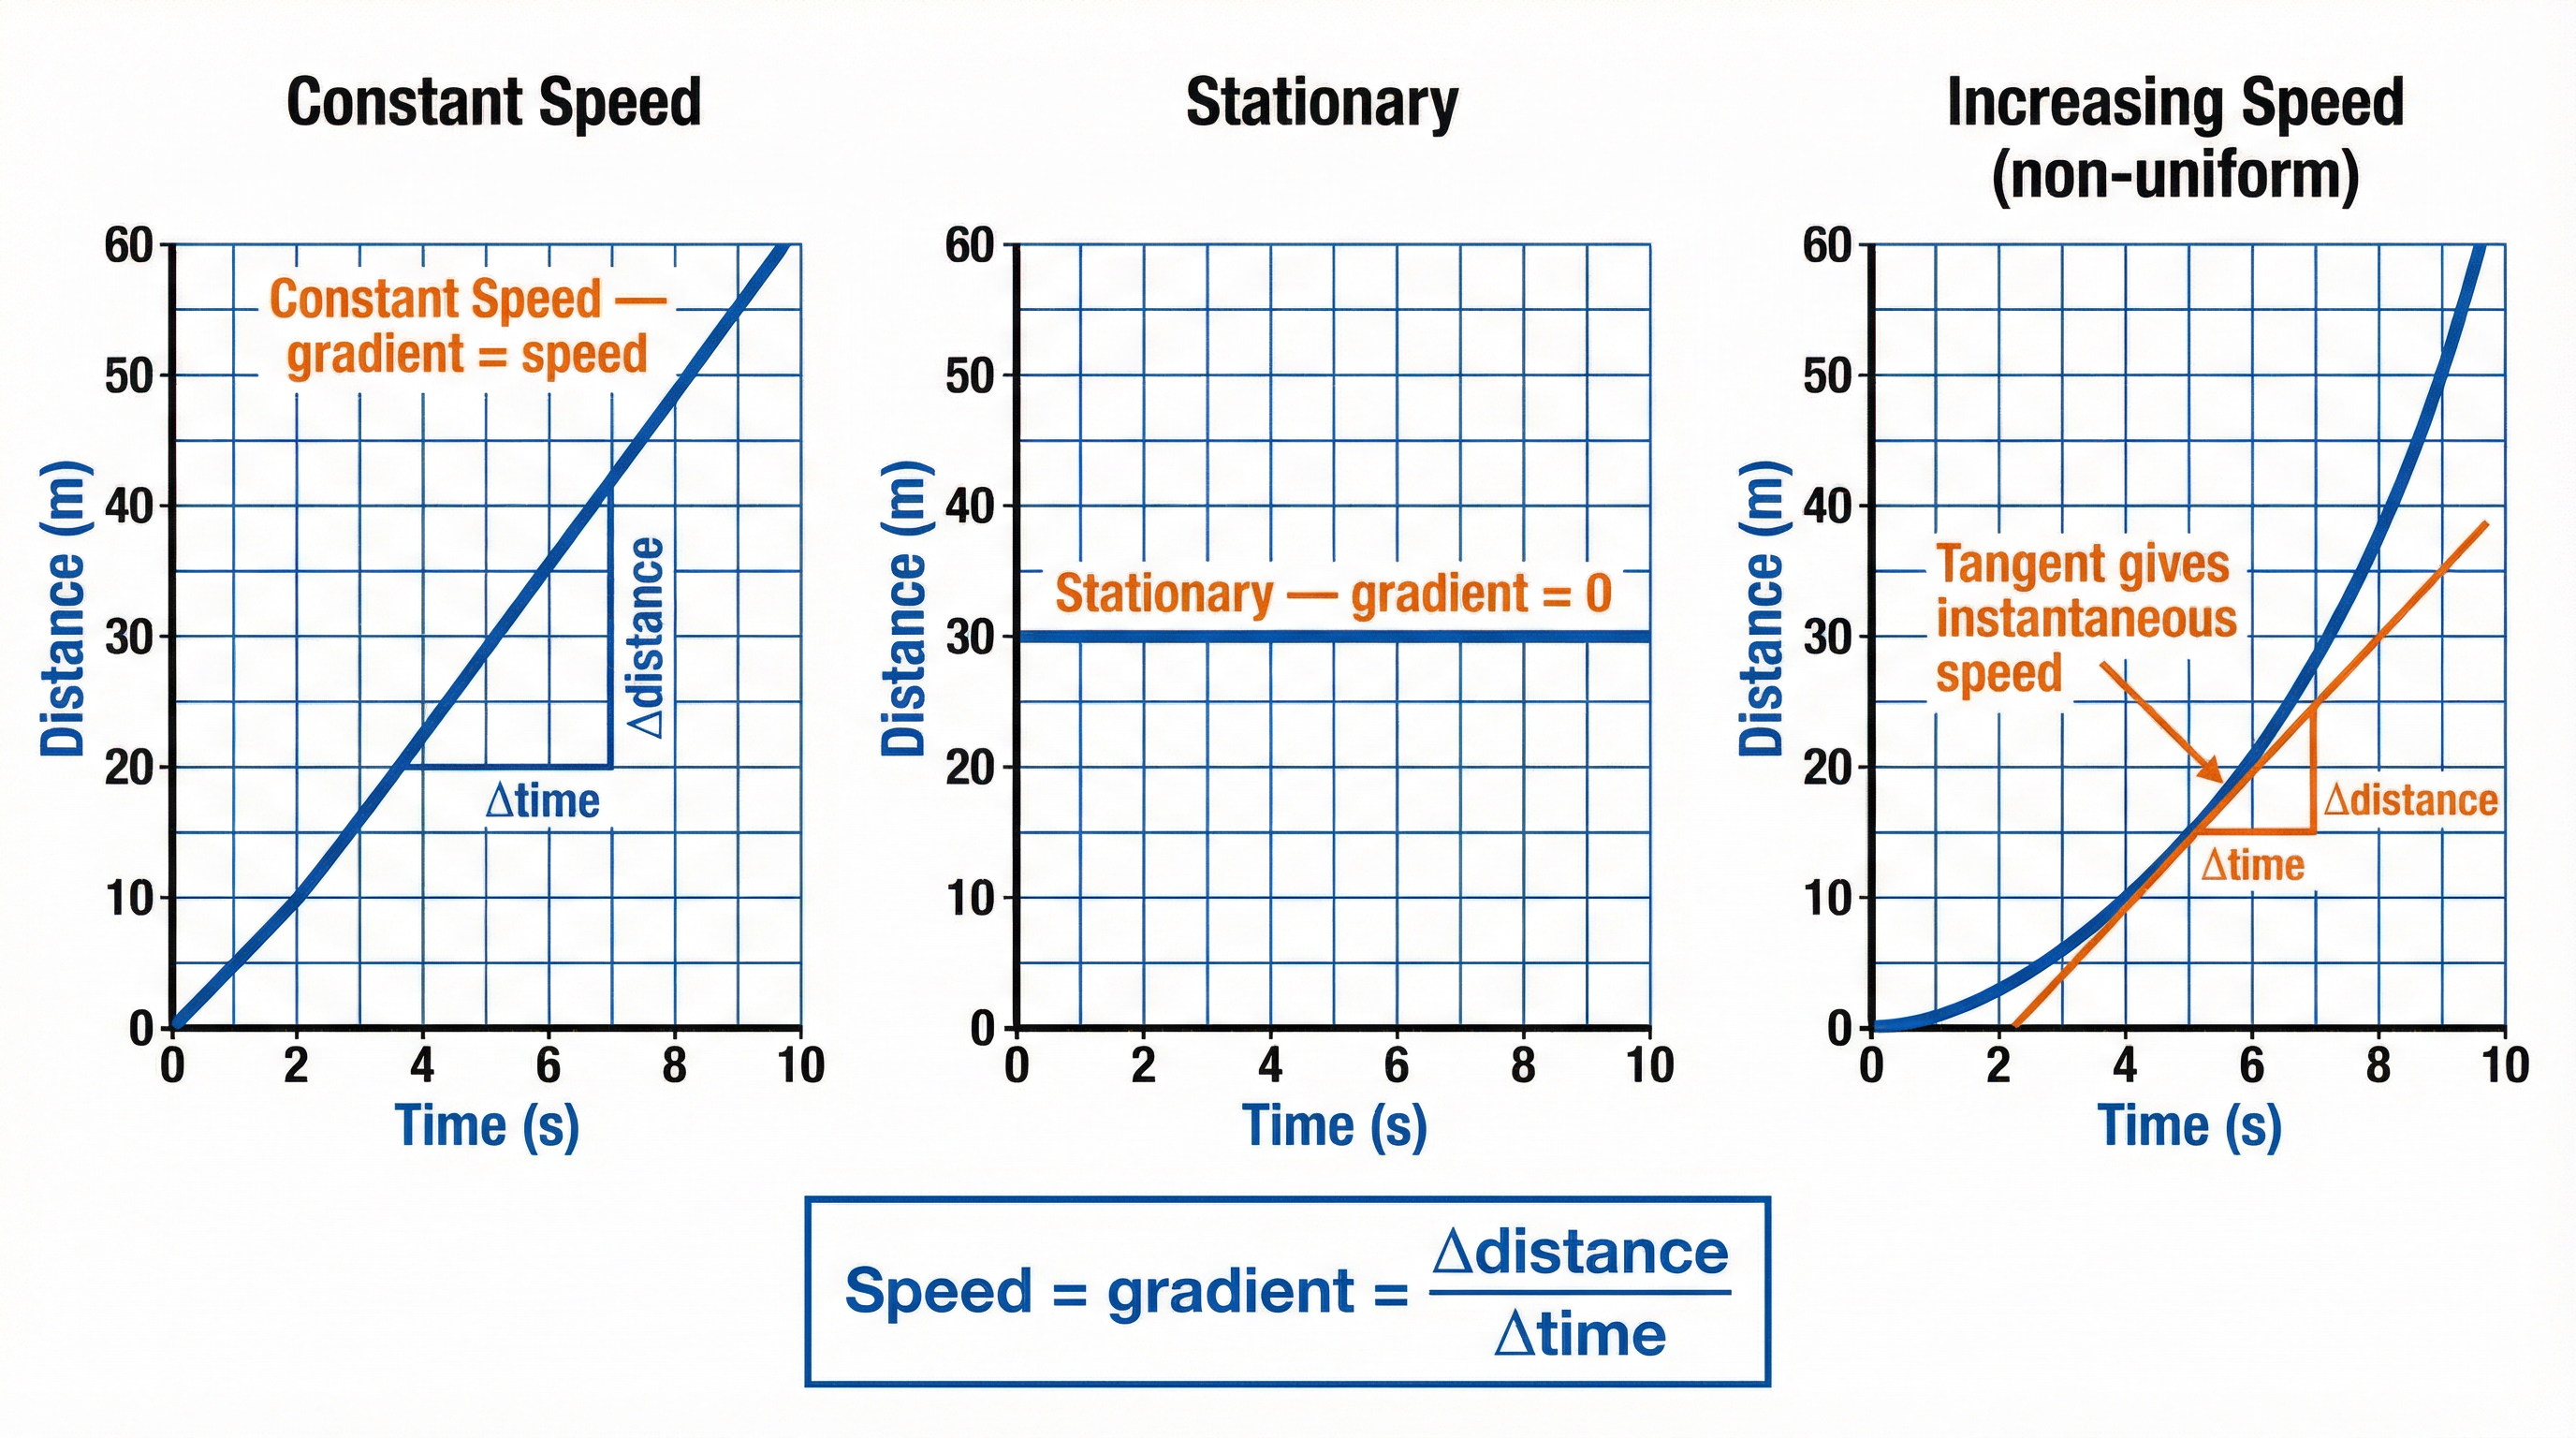
The **gradient (steepness) of the line on a distance-time graph represents the speed**.
- A **horizontal line** means the distance isn't changing. The object is **stationary**. The gradient is zero, so the speed is 0 m/s.
- A **straight, diagonal line** indicates the object is moving at a **constant speed**. The gradient is constant.
- A **curved line** shows that the speed is changing. This is **acceleration** (if the line gets steeper) or **deceleration** (if the line gets flatter).
### Concept 4: Calculating Speed from Graphs
To find the speed from a distance-time graph, you calculate the gradient of the line.
**For a straight line (constant speed):**
Gradient = Change in Distance (rise) / Change in Time (run)
Pick two points on the line, (t1, d1) and (t2, d2). The speed is (d2 - d1) / (t2 - t1).
**For a curved line (changing speed) [Higher Tier Only]:**
To find the instantaneous speed at a specific point, you must draw a **tangent** to the curve at that point. A tangent is a straight line that just touches the curve at that single point. You then calculate the gradient of this tangent to find the speed at that exact moment. A common mistake is to draw a chord (a line connecting two points on the curve), which would incorrectly calculate an average speed over that interval.
## Mathematical/Scientific Relationships
### Formulas
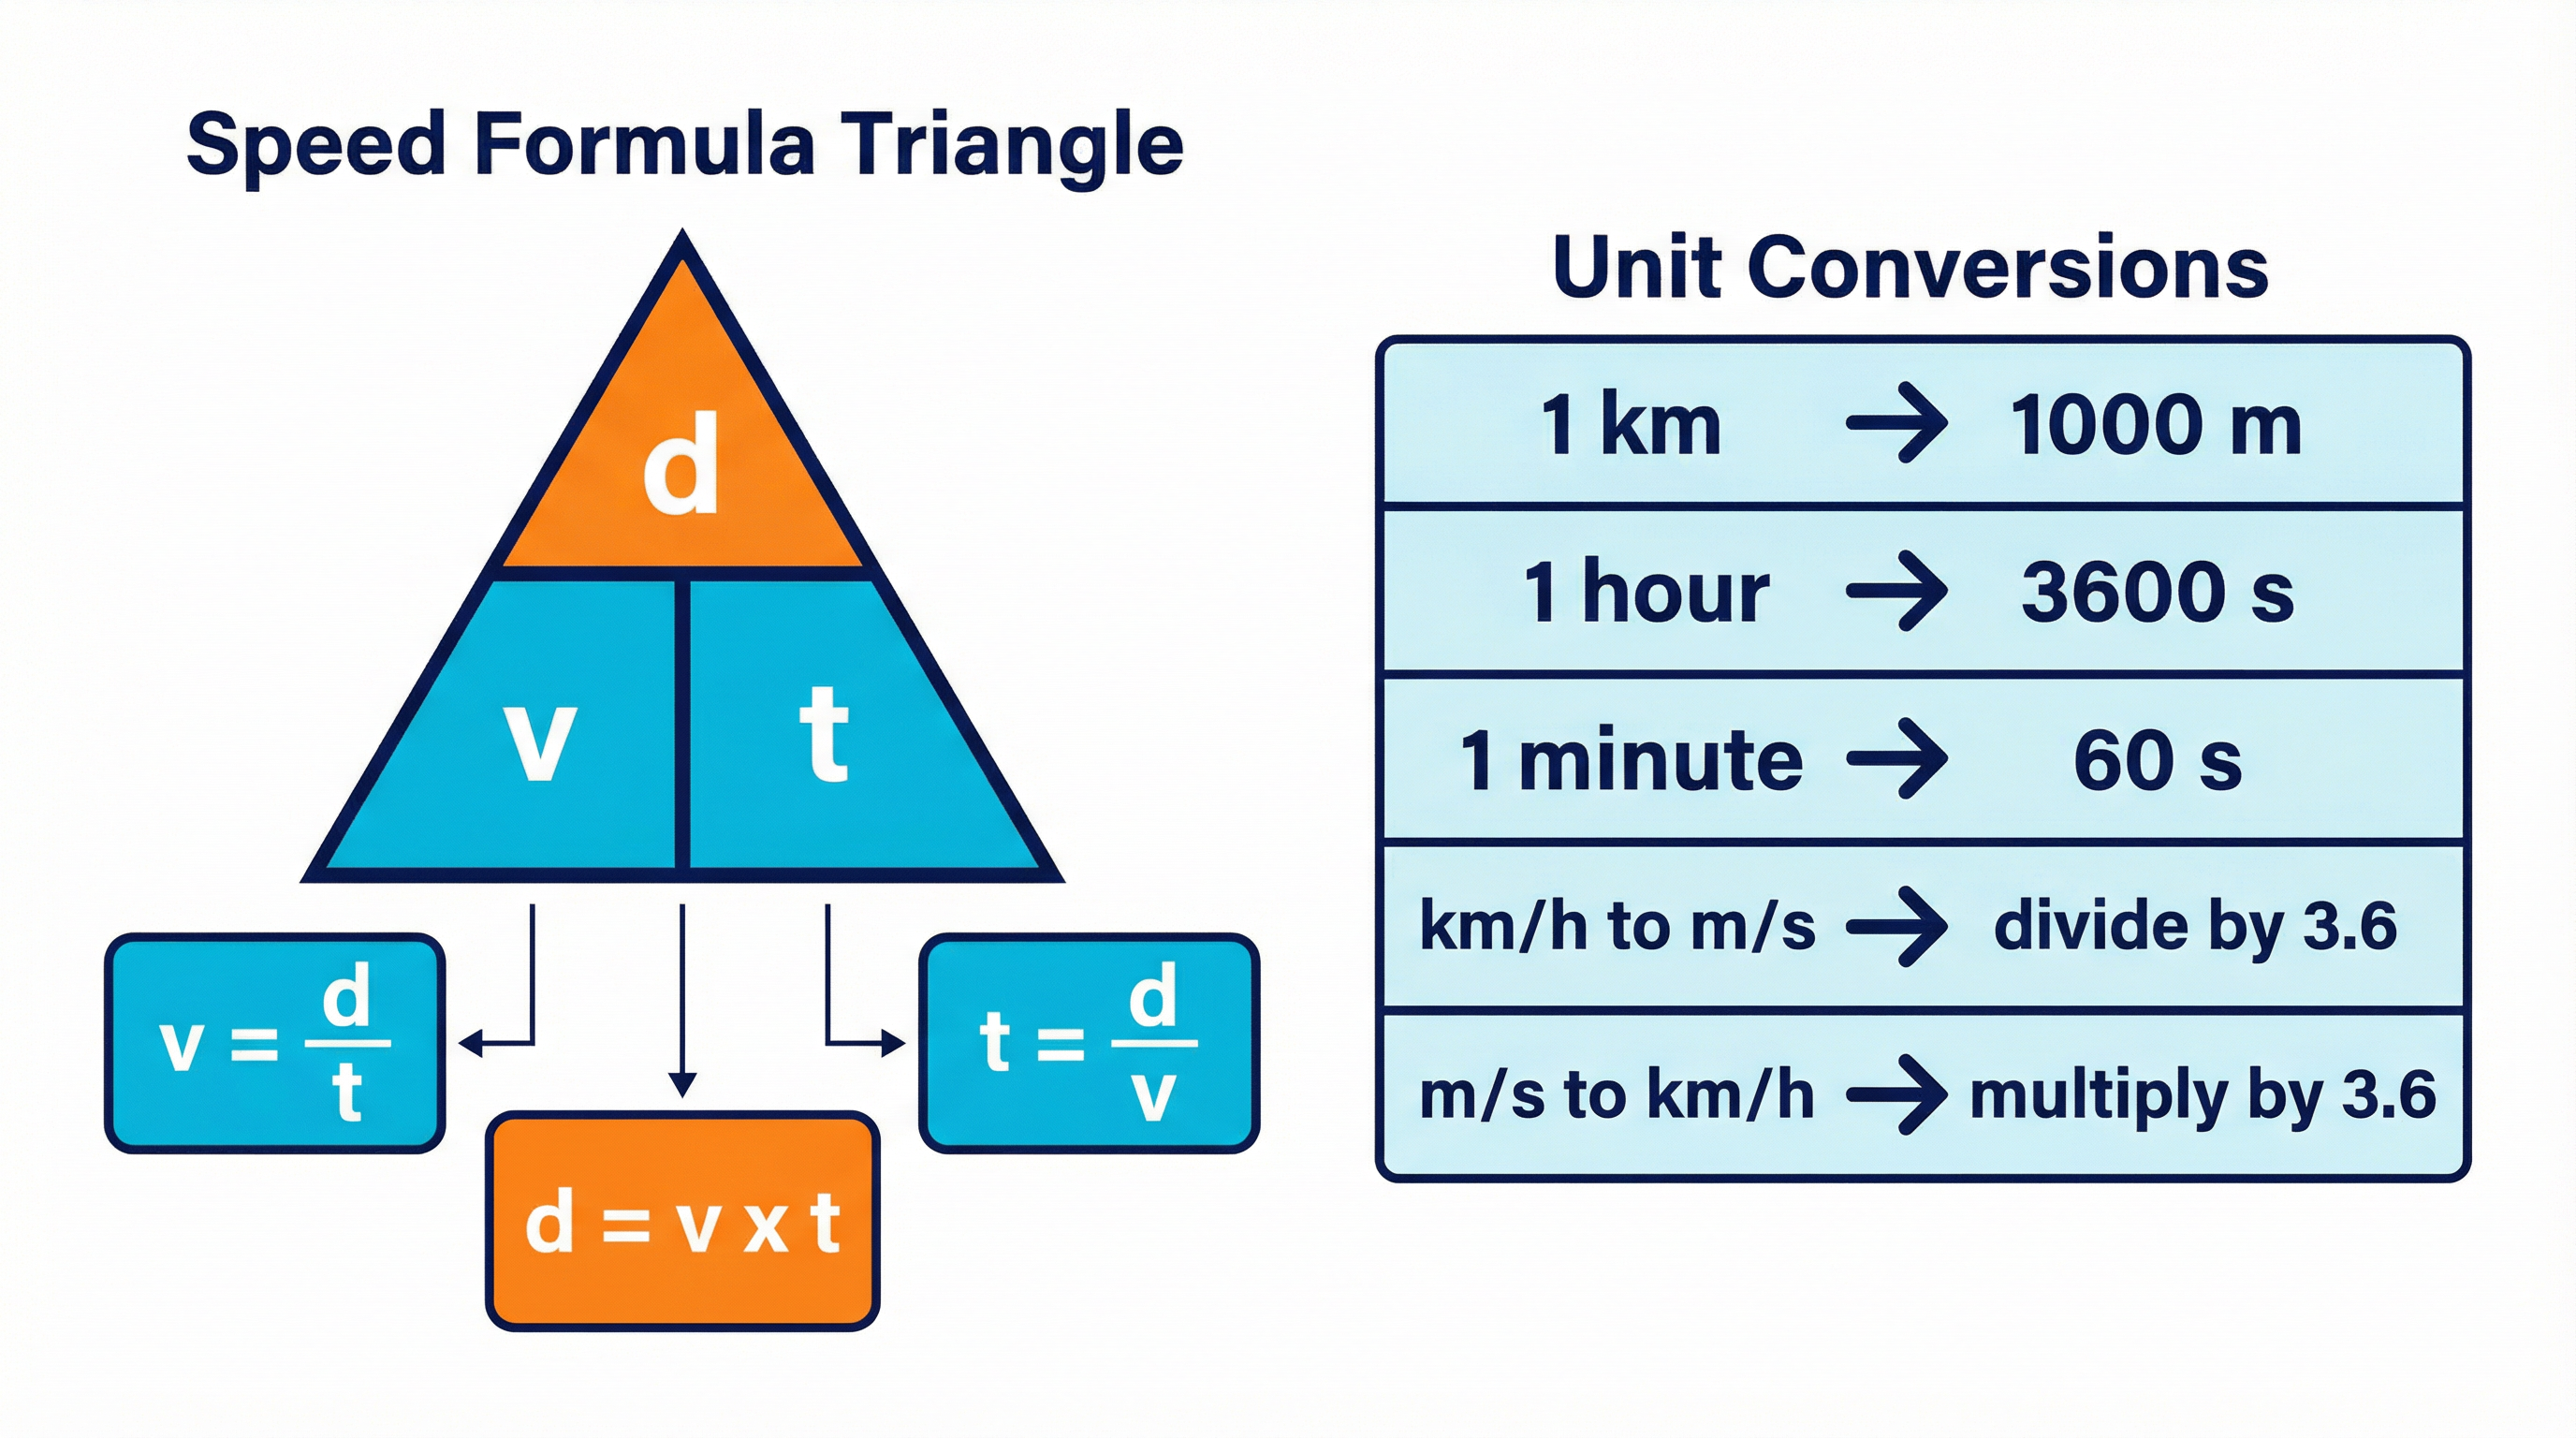
1. **Speed = Distance / Time** (v = d / t)
- **Must memorise.** This is not provided on the OCR formula sheet.
2. **Distance = Speed x Time** (d = v * t)
- **Must memorise.** Rearranged from the main formula.
3. **Time = Distance / Speed** (t = d / v)
- **Must memorise.** Rearranged from the main formula.
### Unit Conversions
Being able to convert units is essential and often worth a specific mark.
- **Time**: 1 hour = 60 minutes = 3600 seconds. Always convert to seconds for calculations in m/s.
- **Distance**: 1 kilometre = 1000 metres.
- **Speed**: To convert from **km/h to m/s**, you **divide by 3.6**. To convert from **m/s to km/h**, you **multiply by 3.6**.
## Practical Applications
This topic has no single required practical, but the principles are tested through interpreting data from experiments measuring speed. For example, an experiment might involve timing a trolley as it rolls down a ramp between two light gates. You would be expected to use the distance between the gates and the time measured to calculate the trolley's average speed.
Real-world applications are everywhere:
- **Vehicle Speedometers**: Measure instantaneous speed.
- **GPS and Satnavs**: Calculate average speed for a journey to predict arrival times.
- **Athletics**: Timing sprints to determine a runner's average speed.
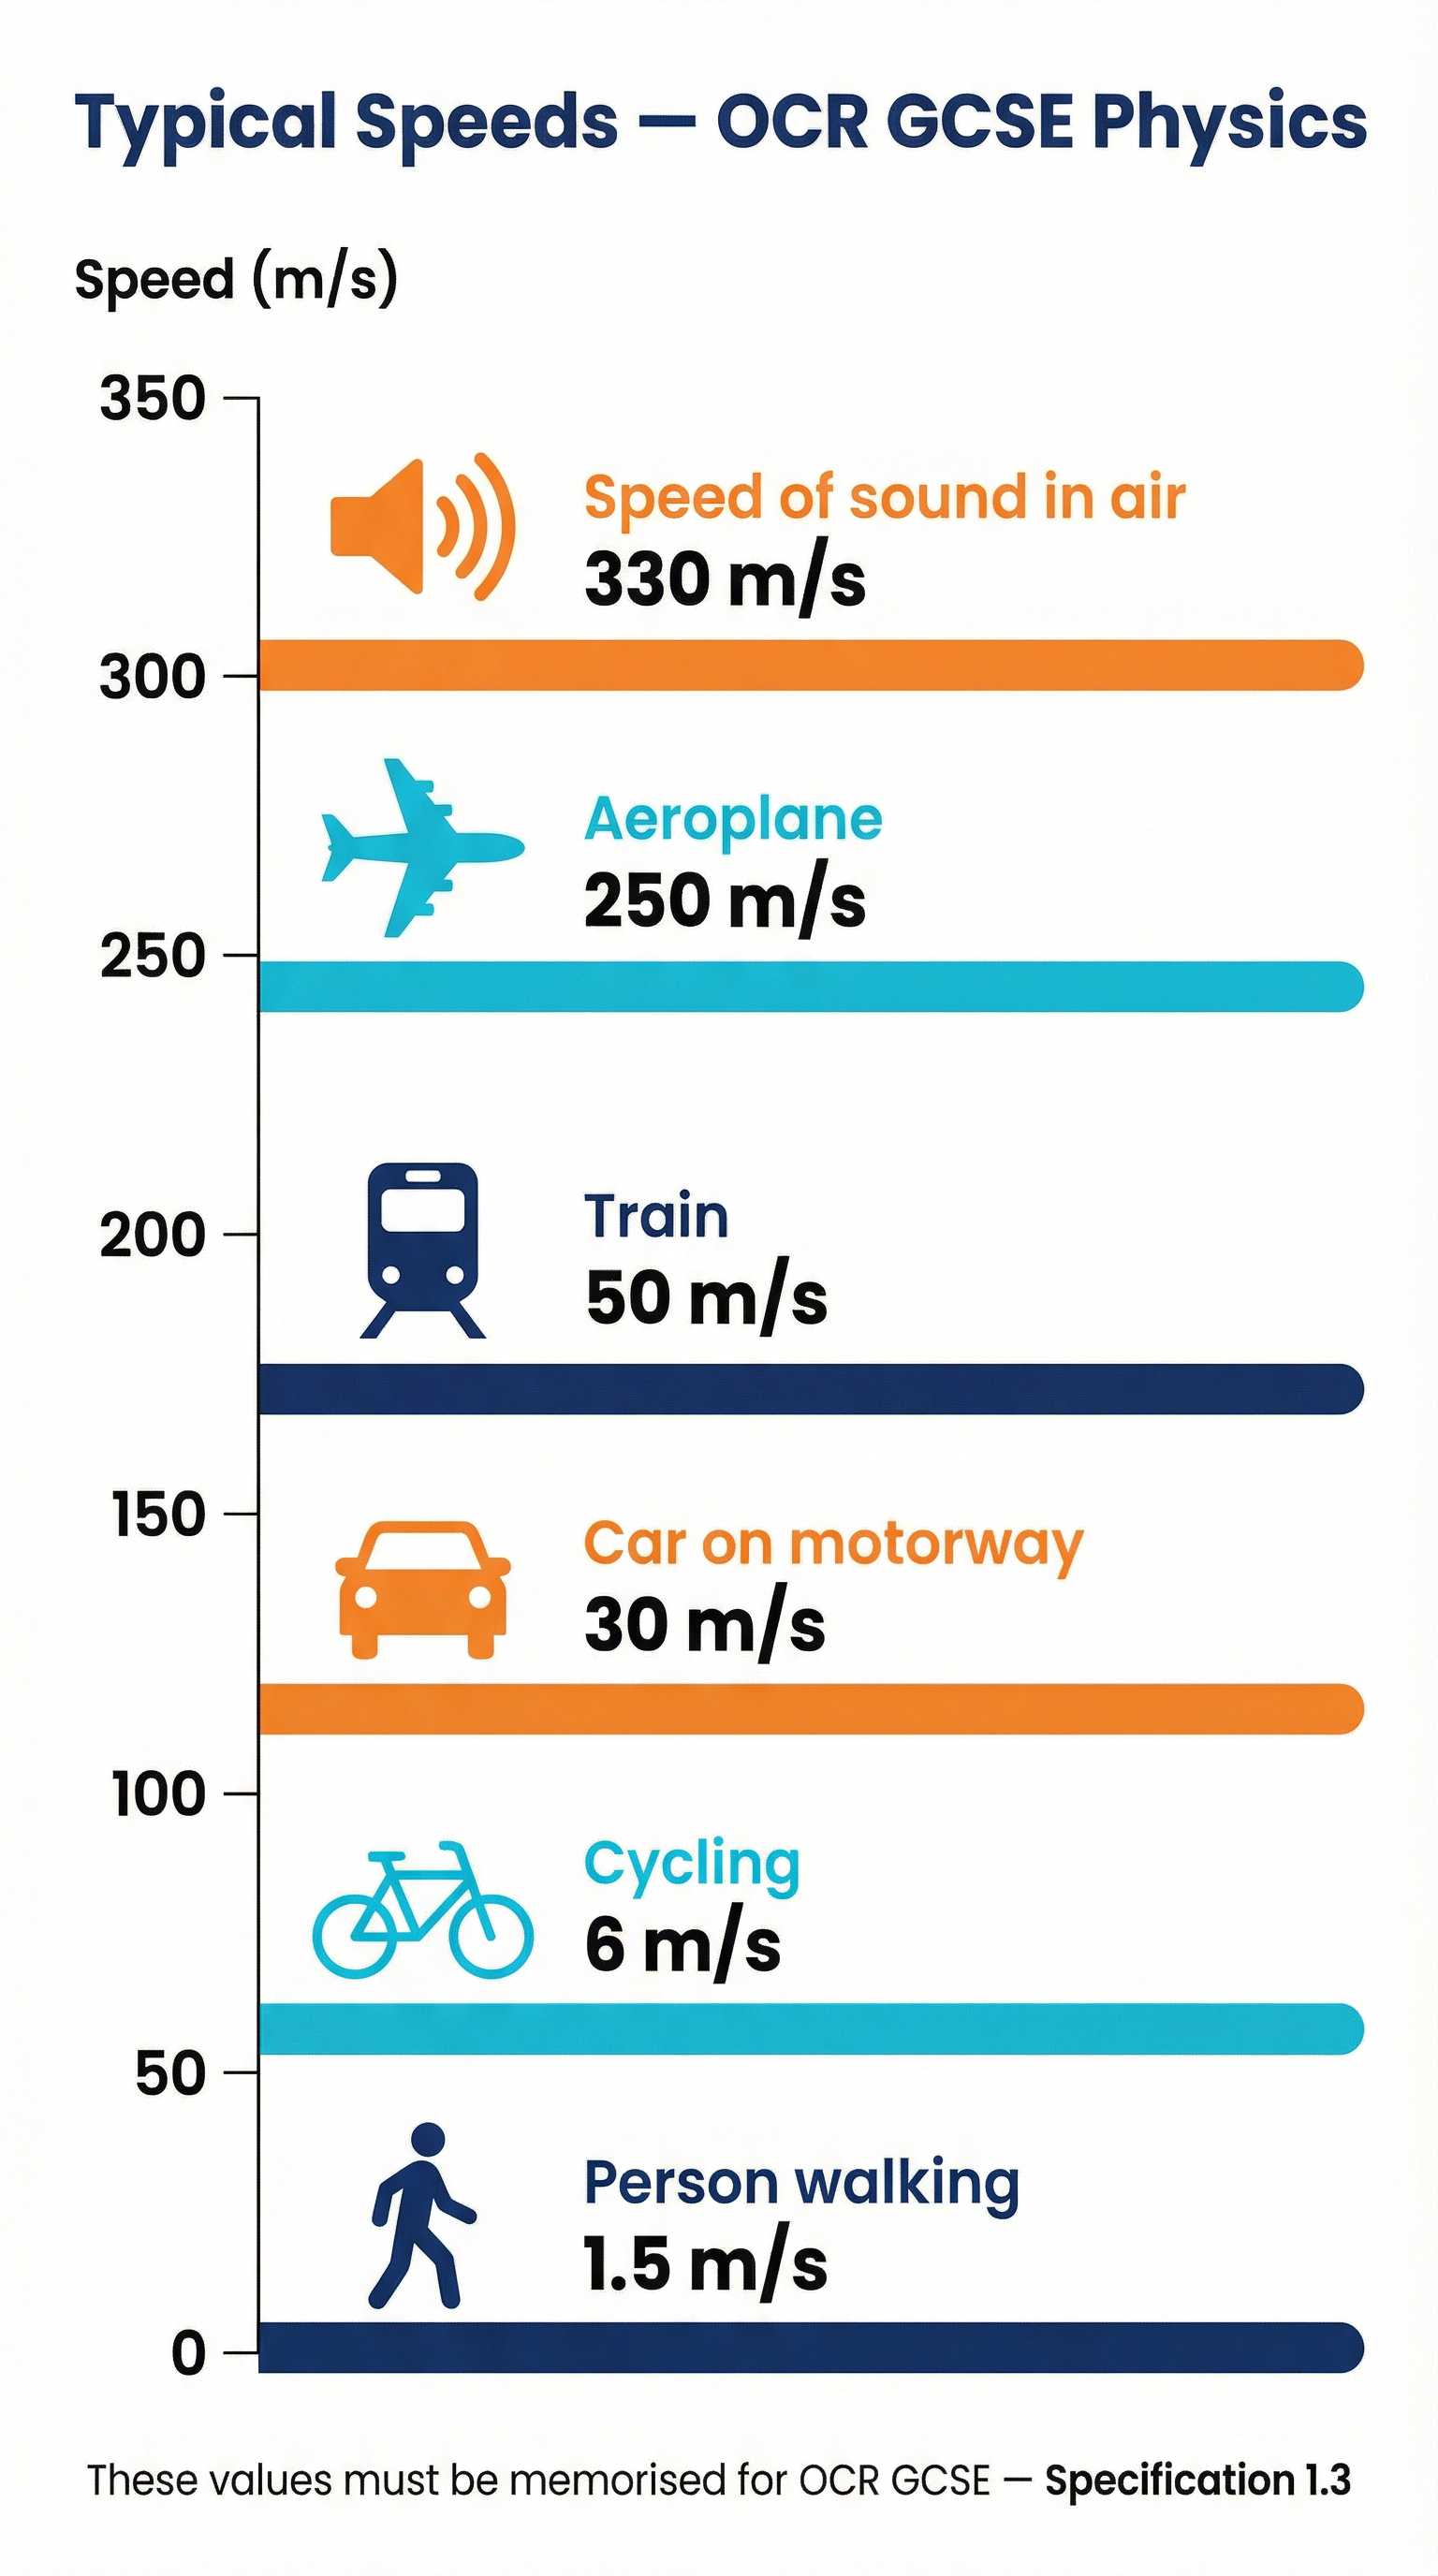
- **Sound**: The delay between seeing lightning and hearing thunder can be used to estimate how far away a storm is, using the speed of sound (~330 m/s).