AQA · A-Level · Psychology
Course version: 7182-2025 · Exams from 2027
Analysis and interpretation of correlation, including correlation…
Full specification wording
Data handling and analysis: Analysis and interpretation of correlation, including correlation coefficients.
A correlation measures how two co-variables move together.
Checked against the AQA 7182-2025 specification (opens in a new tab) on .
- Point 6 of 8
- 4 key terms
Study notes
From the checked teaching notes for this specification point.
The idea
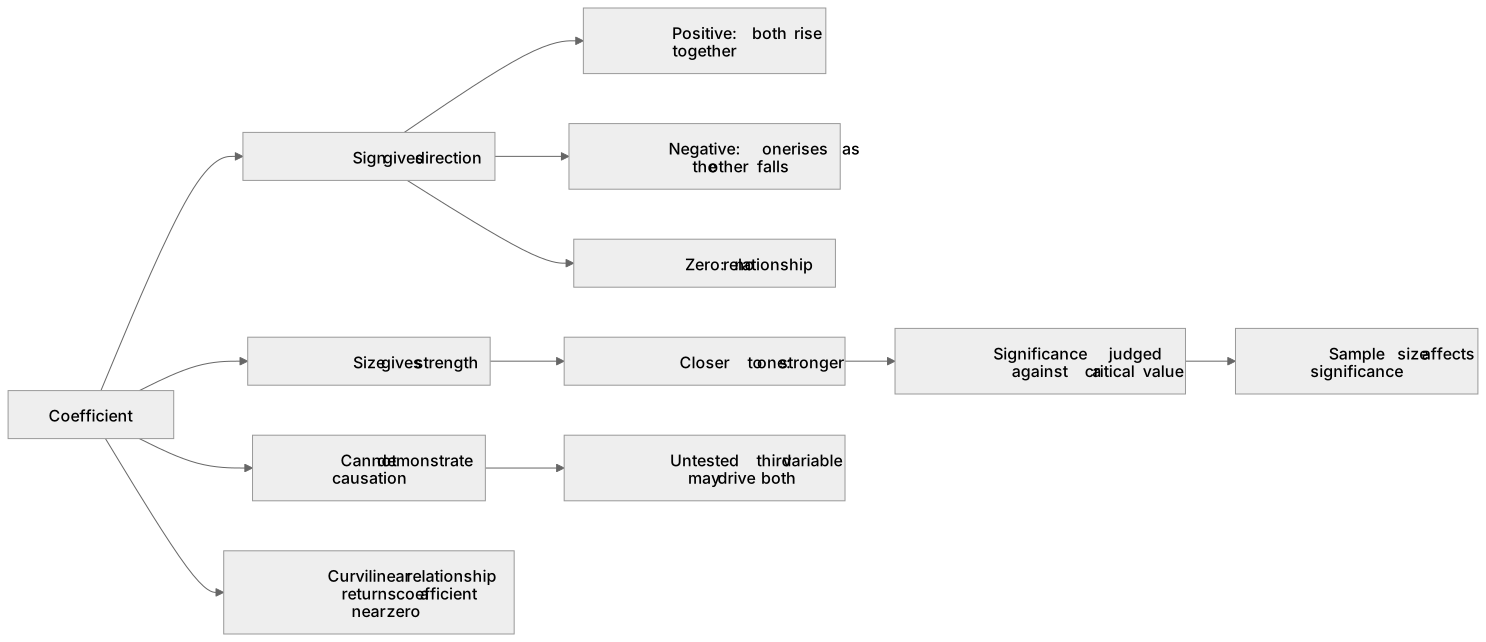
A correlation measures how two co-variables move together. Neither is manipulated, both are merely measured, which is exactly why a correlation can never on its own establish a cause. The coefficient is one number running from -1 through 0 to +1: its sign gives direction and its size gives strength, so a coefficient of -0.76 describes a relationship precisely as strong as +0.76, simply running the other way. A figure near zero means the two vary independently. Whether a coefficient is significant is decided against a critical value table and depends on sample size, so with a large enough sample even a feeble coefficient reaches significance and means little in practice. Two traps follow: a third variable may be driving both, and a curvilinear relationship yields a coefficient close to zero.
What earns the marks
- Correlation defined as an association between two co-variables, both of which are measured rather than manipulated.
- Direction read from the sign: positive means both rise together, negative means one rises as the other falls, zero means no relationship.
- Strength read from how close the figure lies to one, independently of its sign.
- Interpretation set in the stem, stating what the relationship means for the two named variables.
- Significance judged against a critical value, with sample size affecting whether a given coefficient counts as significant.
- Evaluation: a correlation cannot demonstrate causation, because an untested third variable may be responsible for both co-variables.
- Evaluation: a curvilinear relationship, such as arousal and performance, returns a coefficient near zero despite a strong systematic relationship.
Common mistakes and how to put them right
Reading a negative coefficient as a weak one, so that -0.8 is described as weaker than +0.3.
Concluding that one variable causes the other, which is the most heavily penalised error on this topic.
Calling the two measures independent and dependent variables.
Put it right: In a correlation they are co-variables.
Treating a coefficient of zero as a failed study rather than as a genuine finding of no relationship.
Exam tips
- Turn the coefficient into a sentence about the stem's own variables before you evaluate it.
- If asked why a conclusion is unjustified, name a plausible third variable drawn from the scenario instead of stopping at 'correlation is not causation'.
- Quote the figure when you evaluate; 'a strong correlation' without the number leaves the interpretation mark unclaimed.
Try the lesson
The start of the Data handling and analysis: Analysis and interpretation of correlation, including correlation coefficients. lesson, made from checked teaching notes for this specification point.
Have a go first
A researcher calculates a correlation coefficient of -0.85 between the number of hours spent playing video games and scores on a memory test. How should this correlation coefficient be interpreted?
Listen
A correlation measures how two co-variables move together. Neither is manipulated, both are merely measured, which is exactly why a correlation can never on its own establish a cause. The coefficient is one number running from -1 through 0 to +1: its sign gives direction and its size gives strength, so a coefficient of -0.76 describes a relationship precisely as strong as +0.76, simply running the other way. A figure near zero means the two vary independently. Whether a coefficient is significant is decided against a critical value table and depends on sample size, so with a large enough sample even a feeble coefficient reaches significance and means little in practice. Two traps follow: a third variable may be driving both, and a curvilinear relationship yields a coefficient close to zero. A strong answer earns marks for these points. Correlation defined as an association between two co-variables, both of which are measured rather than manipulated. Direction read from the sign: positive means both rise together, negative means one rises as the other falls, zero means no relationship. Strength read from how close the figure lies to one, independently of its sign. Interpretation set in the stem, stating what the relationship means for the two named variables. Exam tip: Turn the coefficient into a sentence about the stem's own variables before you evaluate it.
See it
Key words
Say what each word means before you turn the card.
Co-variables
Try answering aloud or in your head before turning the card.
Correlation coefficient
Try answering aloud or in your head before turning the card.
Causation
Try answering aloud or in your head before turning the card.
Third variables
Try answering aloud or in your head before turning the card.
See every definition
- Co-variables
- The two measures in a correlation, both of which are measured rather than manipulated.
- Correlation coefficient
- One number running from -1 through 0 to +1, whose sign gives direction and whose size gives strength.
- Causation
- A correlation cannot demonstrate this on its own, because an untested third variable may be responsible for both co-variables.
- Third variables
- An untested variable that may be driving both co-variables, so a correlation cannot demonstrate causation.
Label the diagram
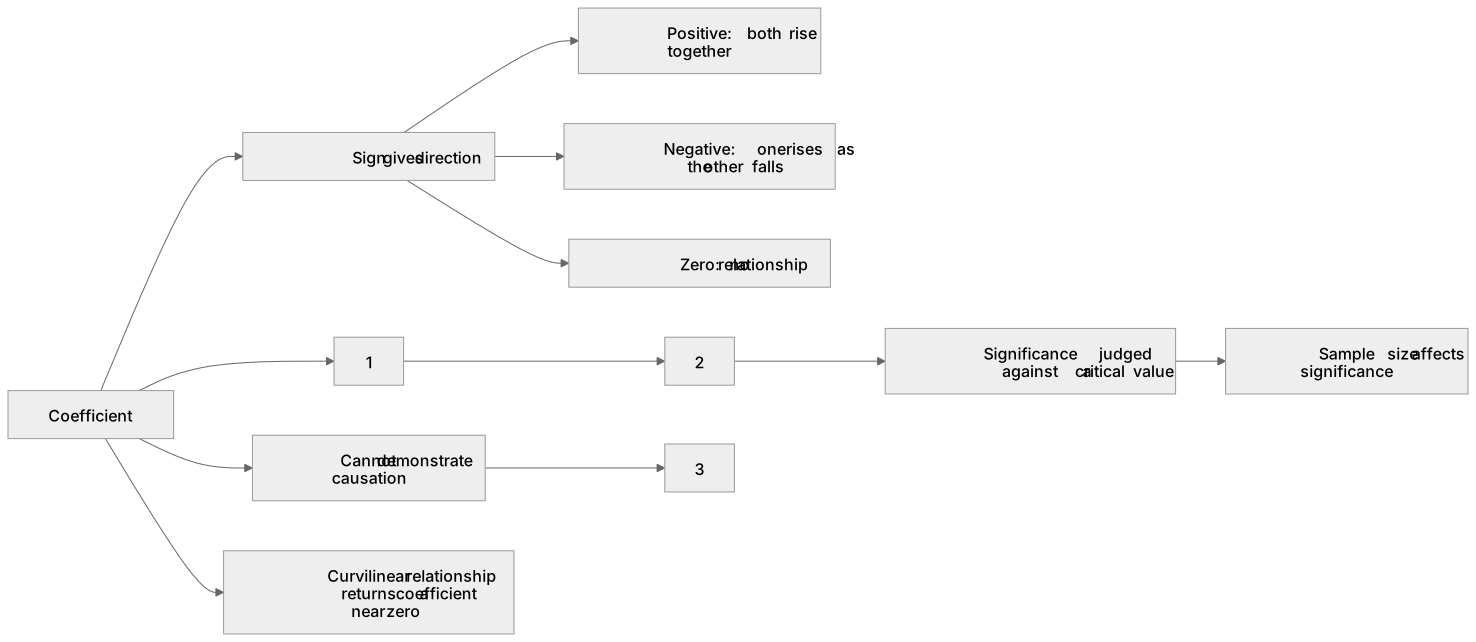
Some boxes have lost their names. Pick the right name for each number.
1Box 1
2Box 2
3Box 3
There is more to this lesson
The full lesson goes on to check your understanding and help you earn the marks. Create a free account to carry on, with your progress saved.
A week of Premium from your first lesson · Then the free plan continues · No card, no charge
Test your understanding of Data handling and analysis: Analysis and interpretation of correlation, including correlation coefficients.
Active recall beats re-reading. Take an instant quiz now to test what you’ve learned and lock it into long-term memory.
A week of Premium from your first lesson · Then the free plan continues · No card, no charge