AQA · A-Level · Psychology
Course version: 7182-2025 · Exams from 2027
Understand the terms mean, median and mode (to include: explaining the…
Full specification wording
Handling data: Understand the terms mean, median and mode (to include: explaining the differences between the mean, median and mode and selecting which measure of central tendency is most appropriate for a given set of data)
The three measures of central tendency summarise data differently, dictating their appropriate use at A-level.
Checked against the AQA 7182-2025 specification (opens in a new tab) on .
- Point 7 of 17
- 4 key terms
Study notes
From the checked teaching notes for this specification point.
The idea
The three measures of central tendency summarise data differently, dictating their appropriate use at A-level. The mean (total divided by n) uses every value, making it the most sensitive measure, ideal for interval data without outliers. However, extreme scores distort the mean. The median is the middle value of an ordered set (or midpoint of the two central values). It resists outliers, making it suitable for ordinal data or skewed interval data. The mode is the most frequent score, essential for nominal data, though it may be unrepresentative or absent. For reaction times of 210, 220, 230, 240 and 980 ms, the mean of 376 is skewed by the 980 ms outlier. The median of 230 ms better represents the typical performance. In a positive skew, the mean is higher than the median and mode; in a normal distribution, all three are equal.
What earns the marks
- Definitions: the mean is the arithmetic average of all scores, the median is the central value of an ordered set, and the mode is the most frequently occurring score.
- Levels of measurement: nominal data require the mode, ordinal data are best summarised by the median, and interval/ratio data allow the mean unless anomalies distort it.
- Skewed distributions: in a positive skew, the mean is pulled higher than the median and mode by extreme high scores; in a negative skew, the mean is pulled lower.
- Justifying selection: always justify the choice of measure using specific features of the data in the stem, such as identifying a specific outlier (e.g., 980 ms) that distorts the mean.
- Strengths and limitations: the mean is highly sensitive but vulnerable to outliers; the median is robust against extreme scores but ignores exact values; the mode works with categories but may not exist.
Common mistakes and how to put them right
Failing to put the scores in numerical order before identifying the median, resulting in selecting the centre of the unordered list.
Reporting 'no mode' as a mode of zero, when zero is a valid score.
Put it right: The absence of any repeated value should be explicitly stated as having no mode.
Choosing the mean for ordinal data (e.g., subjective rating scales from 1 to 10), where the intervals between points are not guaranteed to be equal.
Exam tips
- When asked which measure is most appropriate, name the measure and provide a justification explicitly linked to the data set provided, such as the presence of an outlier or the level of measurement.
- If a data set is skewed, explicitly state which direction the mean is pulled and by which specific score to demonstrate understanding of distortion.
Try the lesson
The start of the Handling data: Understand the terms mean, median and mode (to include: explaining the differences between the mean, median and mode and selecting which measure of central tendency is most appropriate for a given set of data) lesson, made from checked teaching notes for this specification point.
Have a go first
A researcher wants to find the average score for a set of data that includes a few extreme outlier values. Which measure of central tendency is most appropriate to use, and why?
Listen
The three measures of central tendency summarise data differently, dictating their appropriate use at A-level. The mean (total divided by n) uses every value, making it the most sensitive measure, ideal for interval data without outliers. However, extreme scores distort the mean. The median is the middle value of an ordered set (or midpoint of the two central values). It resists outliers, making it suitable for ordinal data or skewed interval data. The mode is the most frequent score, essential for nominal data, though it may be unrepresentative or absent. For reaction times of 210, 220, 230, 240 and 980 ms, the mean of 376 is skewed by the 980 ms outlier. The median of 230 ms better represents the typical performance. In a positive skew, the mean is higher than the median and mode; in a normal distribution, all three are equal. A strong answer earns marks for these points. Definitions: the mean is the arithmetic average of all scores, the median is the central value of an ordered set, and the mode is the most frequently occurring score. Levels of measurement: nominal data require the mode, ordinal data are best summarised by the median, and interval/ratio data allow the mean unless anomalies distort it. Skewed distributions: in a positive skew, the mean is pulled higher than the median and mode by extreme high scores; in a negative skew, the mean is pulled lower. Justifying selection: always justify the choice of measure using specific features of the data in the stem, such as identifying a specific outlier (e.g., 980 ms) that distorts the mean. Exam tip: When asked which measure is most appropriate, name the measure and provide a justification explicitly linked to the data set provided, such as the presence of an outlier or the level of measurement.
See it
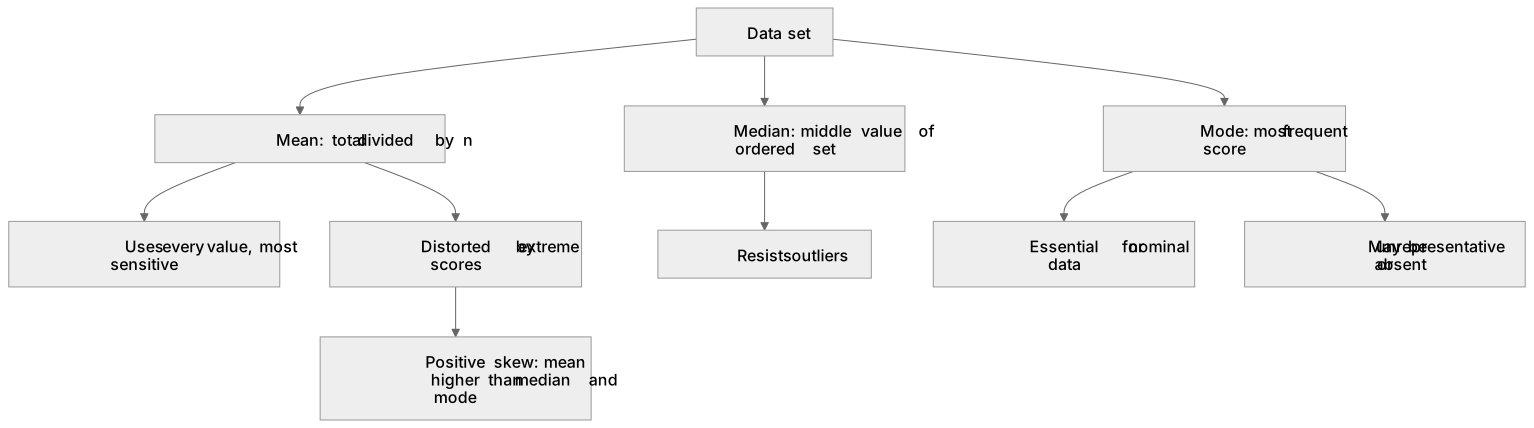
Key words
Say what each word means before you turn the card.
central tendency
Try answering aloud or in your head before turning the card.
levels of measurement
Try answering aloud or in your head before turning the card.
skewed distributions
Try answering aloud or in your head before turning the card.
outliers
Try answering aloud or in your head before turning the card.
See every definition
- central tendency
- The mean, median and mode, which summarise data differently and dictate their appropriate use.
- levels of measurement
- Nominal data require the mode, ordinal data are best summarised by the median, and interval/ratio data allow the mean unless anomalies distort it.
- skewed distributions
- In a positive skew the mean is pulled higher than the median and mode by extreme high scores; in a negative skew the mean is pulled lower.
- outliers
- Extreme scores that distort the mean, which the median resists.
Label the diagram
Some boxes have lost their names. Pick the right name for each number.
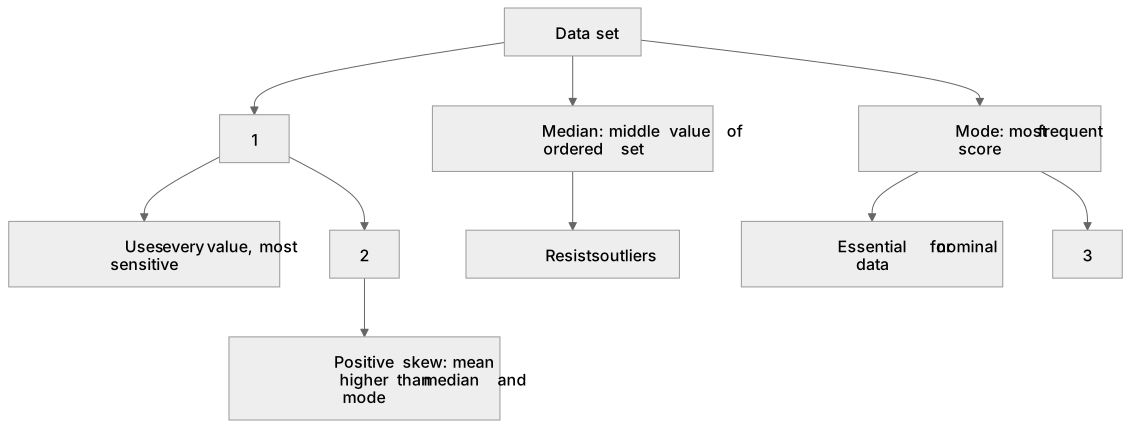
1Box 1
2Box 2
3Box 3
There is more to this lesson
The full lesson goes on to check your understanding and help you earn the marks. Create a free account to carry on, with your progress saved.
A week of Premium from your first lesson · Then the free plan continues · No card, no charge
Test your understanding of Handling data: Understand the terms mean, median and mode (to include: explaining the differences between the mean, median and mode and selecting which measure of central tendency is most appropriate for a given set of data)
Active recall beats re-reading. Take an instant quiz now to test what you’ve learned and lock it into long-term memory.
A week of Premium from your first lesson · Then the free plan continues · No card, no charge