AQA · A-Level · Psychology
Course version: 7182-2025 · Exams from 2027
Handling data: Calculate standard deviation.
Standard deviation measures how far scores typically spread from their mean.
Checked against the AQA 7182-2025 specification (opens in a new tab) on .
- Point 6 of 17
- 4 key terms
Study notes
From the checked teaching notes for this specification point.
The idea
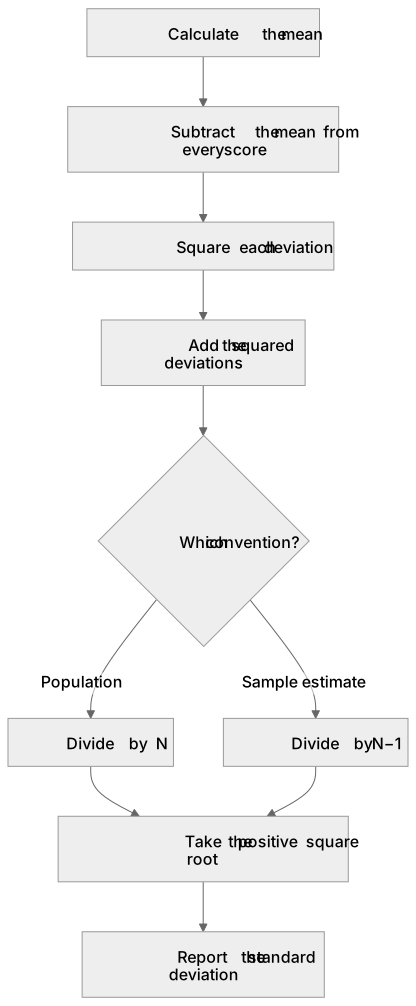
Standard deviation measures how far scores typically spread from their mean. First calculate the mean, subtract it from every score, square each deviation and add the squared deviations. Divide by N when the data are treated as the complete population, or by N−1 when estimating a population from a sample, then take the positive square root. For scores 2, 4 and 6, the mean is 4 and the squared deviations total 8: the population standard deviation is √(8÷3), while the sample standard deviation is √(8÷2)=2. State the convention used, show each stage and retain enough precision until the final answer. A smaller value means tighter clustering around the mean; a larger value means greater dispersion.
What earns the marks
- Calculate the arithmetic mean of the full data set before finding each score's deviation from that mean.
- Square every deviation and add the squared values so that positive and negative deviations do not cancel.
- Divide the squared-deviation total by the denominator required by the stated convention: N for a population or N−1 for a sample estimate.
- Take the positive square root of the variance and report the standard deviation with suitable units and precision.
- Interpret the result comparatively: a smaller standard deviation indicates scores clustered more tightly around their mean.
Common mistakes and how to put them right
Letting positive and negative deviations cancel.
Put it right: Square each deviation before adding them.
Using N and N−1 interchangeably.
Put it right: Identify whether the requested convention is population or sample standard deviation and label the result.
Stopping at the variance.
Put it right: Take its positive square root to obtain the standard deviation.
Rounding intermediate values too early.
Put it right: Retain calculator precision and round only the final result.
Exam tips
- Write the mean and the squared-deviation total in your working so the calculation method remains clear even if the final arithmetic slips.
- Check which standard-deviation convention the question, supplied formula or calculator mode requires, and state the one used.
- Give the final value to sensible precision and in the same units as the original scores.
- When comparing groups, discuss the standard deviations alongside their means because spread and central tendency answer different questions.
Try the lesson
The start of the Handling data: Calculate standard deviation. lesson, made from checked teaching notes for this specification point.
Have a go first
A researcher records the number of errors made by three participants in a maze task: 3, 5, and 7. The mean number of errors is 5. Using the sample standard deviation formula (dividing by N-1), what is the standard deviation of this dataset?
Listen
Standard deviation measures how far scores typically spread from their mean. First calculate the mean, subtract it from every score, square each deviation and add the squared deviations. Divide by N when the data are treated as the complete population, or by N−1 when estimating a population from a sample, then take the positive square root. For scores 2, 4 and 6, the mean is 4 and the squared deviations total 8: the population standard deviation is √(8÷3), while the sample standard deviation is √(8÷2)=2. State the convention used, show each stage and retain enough precision until the final answer. A smaller value means tighter clustering around the mean; a larger value means greater dispersion. A strong answer earns marks for these points. Calculate the arithmetic mean of the full data set before finding each score's deviation from that mean. Square every deviation and add the squared values so that positive and negative deviations do not cancel. Divide the squared-deviation total by the denominator required by the stated convention: N for a population or N−1 for a sample estimate. Take the positive square root of the variance and report the standard deviation with suitable units and precision. Exam tip: Write the mean and the squared-deviation total in your working so the calculation method remains clear even if the final arithmetic slips.
See it
Key words
Say what each word means before you turn the card.
Measures of dispersion
Try answering aloud or in your head before turning the card.
Variance and standard deviation
Try answering aloud or in your head before turning the card.
Population and sample conventions
Try answering aloud or in your head before turning the card.
Consistency of scores
Try answering aloud or in your head before turning the card.
See every definition
- Measures of dispersion
- A smaller value means tighter clustering around the mean, while a larger value means greater dispersion.
- Variance and standard deviation
- The variance is the squared-deviation total divided by the required denominator, and the standard deviation is its positive square root.
- Population and sample conventions
- Divide by N when the data are treated as the complete population, or by N−1 when estimating a population from a sample.
- Consistency of scores
- A smaller standard deviation indicates scores clustered more tightly around their mean, and a larger one indicates greater dispersion.
There is more to this lesson
The full lesson goes on to check your understanding and help you earn the marks. Create a free account to carry on, with your progress saved.
A week of Premium from your first lesson · Then the free plan continues · No card, no charge
Test your understanding of Handling data: Calculate standard deviation.
Active recall beats re-reading. Take an instant quiz now to test what you’ve learned and lock it into long-term memory.
A week of Premium from your first lesson · Then the free plan continues · No card, no charge