AQA · A-Level · Psychology
Course version: 7182-2025 · Exams from 2027
Use a statistical test (to include: calculating a non-parametric test of…
Full specification wording
Handling data: Use a statistical test (to include: calculating a non-parametric test of differences using data from a given experiment)
Choosing a statistical test requires three questions: difference or relationship, related or unrelated design, and level of measurement.
Checked against the AQA 7182-2025 specification (opens in a new tab) on .
- Point 9 of 17
- 3 key terms
Study notes
From the checked teaching notes for this specification point.
The idea
Choosing a statistical test requires three questions: difference or relationship, related or unrelated design, and level of measurement. Nominal data use Chi-Square (unrelated) or Sign test (related). Ordinal data use Mann-Whitney U (unrelated) or Wilcoxon (related). Interval data use unrelated or related t-tests. Relationships use Spearman's rho (ordinal) or Pearson's r (interval). To use a statistical test, name these features to justify the choice. When calculating a non-parametric test of differences using data from a given experiment, such as the Sign test, follow the specific steps, then compare the calculated value with the critical value to determine significance.
What earns the marks
- Reading the table: find the row using degrees of freedom (df) or sample size ($N$), and the column using the significance level and whether the hypothesis is directional (one-tailed) or non-directional (two-tailed).
- The conclusion sentence names the test, calculated value, critical value, significance level, and tail, then states whether the null hypothesis is rejected and interprets the finding.
Common mistakes and how to put them right
Reversing the comparison, such as declaring a Sign test value significant when it is larger than the critical value.
Put it right: This statistic requires the calculated value to be equal to or less than the critical value.
Forgetting to use the absolute value for correlation coefficients or t-values.
Put it right: A calculated value of -0.65 is significant if its magnitude (0.65) is greater than or equal to the critical value.
Failing to discard zero differences when calculating the Sign test, which incorrectly inflates the sample size ($N$) used to find the critical value.
Exam tips
- In a calculation question, marks are awarded for intermediate steps, so set out your signs and totals for the Sign test in full.
- When justifying a test choice, explicitly state all three criteria: the test of difference/relationship, the experimental design, and the level of measurement.
Try the lesson
The start of the Handling data: Use a statistical test (to include: calculating a non-parametric test of differences using data from a given experiment) lesson, made from checked teaching notes for this specification point.
Have a go first
A psychologist uses a Sign test to analyse data from a repeated measures design. Seven participants showed an increase in their scores, two showed a decrease, and one participant's score remained unchanged. What is the calculated value of S?
Listen
Choosing a statistical test requires three questions: difference or relationship, related or unrelated design, and level of measurement. Nominal data use Chi-Square (unrelated) or Sign test (related). Ordinal data use Mann-Whitney U (unrelated) or Wilcoxon (related). Interval data use unrelated or related t-tests. Relationships use Spearman's rho (ordinal) or Pearson's r (interval). To use a statistical test, name these features to justify the choice. When calculating a non-parametric test of differences using data from a given experiment, such as the Sign test, follow the specific steps, then compare the calculated value with the critical value to determine significance. A strong answer earns marks for these points. The direction of the comparison: Chi-Square, and the absolute values of Spearman's rho, Pearson's r, and t-tests are significant when the calculated value is \ge the critical value. Mann-Whitney U, Wilcoxon T, and the Sign test are significant when the calculated value is \le the critical value. Reading the table: find the row using degrees of freedom (df) or sample size (N), and the column using the significance level and whether the hypothesis is directional (one-tailed) or non-directional (two-tailed). Calculating the Sign test: subtract one condition from the other to find the sign of difference (+ or -), discard zero differences to find the new N, and count the frequency of the less frequent sign to find the calculated value S. The conclusion sentence names the test, calculated value, critical value, significance level, and tail, then states whether the null hypothesis is rejected and interprets the finding. Exam tip: In a calculation question, marks are awarded for intermediate steps, so set out your signs and totals for the Sign test in full.
See it
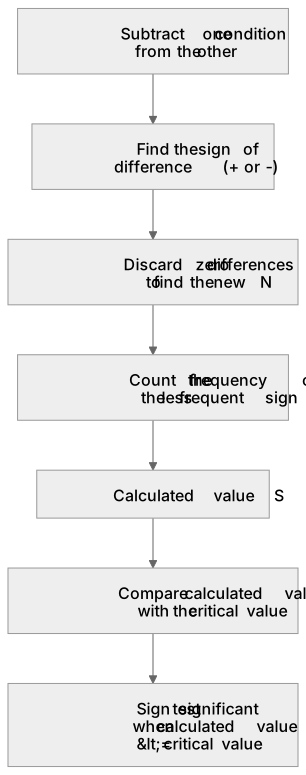
Put it in order
Put these steps in the order they happen.
- 1. Sign test significant when calculated value is <= critical value
- 2. Compare calculated value with the critical value
- 3. Discard zero differences to find the new N
- 4. Calculated value S
- 5. Subtract one condition from the other
- 6. Find the sign of difference (+ or -)
- 7. Count the frequency of the less frequent sign
Key words
Say what each word means before you turn the card.
choosing a statistical test
Try answering aloud or in your head before turning the card.
calculating the Sign test
Try answering aloud or in your head before turning the card.
critical values and significance
Try answering aloud or in your head before turning the card.
See every definition
- choosing a statistical test
- Requires three questions: difference or relationship, related or unrelated design, and level of measurement, named to justify the choice.
- calculating the Sign test
- Subtract one condition from the other to find the sign of difference, discard zero differences to find the new N, and count the frequency of the less frequent sign to find the calculated value S.
- critical values and significance
- Compare the calculated value with the critical value to determine significance, reading the table by degrees of freedom or sample size and the significance level and tail.
Label the diagram
Some boxes have lost their names. Pick the right name for each number.
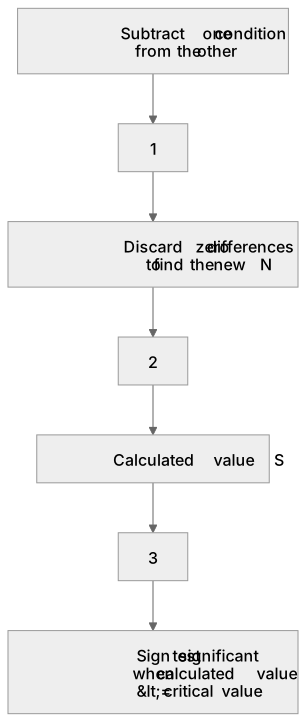
1Box 1
2Box 2
3Box 3
There is more to this lesson
The full lesson goes on to check your understanding and help you earn the marks. Create a free account to carry on, with your progress saved.
A week of Premium from your first lesson · Then the free plan continues · No card, no charge
Test your understanding of Handling data: Use a statistical test (to include: calculating a non-parametric test of differences using data from a given experiment)
Active recall beats re-reading. Take an instant quiz now to test what you’ve learned and lock it into long-term memory.
A week of Premium from your first lesson · Then the free plan continues · No card, no charge