AQA · A-Level · Psychology
Course version: 7182-2025 · Exams from 2027
Use statistical tables to determine significance (to include: using an…
Full specification wording
Handling data: Use statistical tables to determine significance (to include: using an extract from statistical tables to say whether or not a given observed value is significant at the 0.05 level of significance for a one-tailed test)
An inferential test produces an observed value, and a table of critical values decides whether that value is unlikely enough to count.
Checked against the AQA 7182-2025 specification (opens in a new tab) on .
- Point 14 of 17
- 4 key terms
Study notes
From the checked teaching notes for this specification point.
The idea
An inferential test produces an observed value, and a table of critical values decides whether that value is unlikely enough to count. Reading the table needs three facts from the study: the level of significance, normally 0.05, whether the hypothesis was directional and so one tailed or non directional and so two tailed, and either the number of participants or of pairs or the degrees of freedom. Then the comparison runs in a direction fixed by the test. Chi Square, Spearman's rho, Pearson's r and both t tests need the observed value to be equal to or greater than the critical value. Mann Whitney U, Wilcoxon and the sign test need the observed value to be equal to or less than the critical value before the null hypothesis can be rejected.
What earns the marks
- Selecting the right cell of the table: the column for p less than or equal to 0.05, the one tailed side for a directional hypothesis, and the row for the degrees of freedom or the value of N that the test uses.
- Working out degrees of freedom where the test needs them, so Chi Square uses (rows - 1)(columns - 1) and the related t test uses the number of pairs minus one.
- Stating the comparison in full with both figures, for example that an observed Chi Square value of 7.82 is greater than the critical value of 3.84 for one degree of freedom at p less than or equal to 0.05.
- Concluding in the language of hypotheses: the result is significant, the null hypothesis is rejected, and the probability that the difference arose by chance is five percent or less.
Common mistakes and how to put them right
Reading the two tailed column when the hypothesis predicted a direction, which applies a stricter critical value and can turn a significant result into a non significant one.
Applying the greater than rule to every test, so an observed Wilcoxon value of 8 against a critical value of 21 is called non significant when the result is in fact significant.
Using the number of participants where the table asks for degrees of freedom, or reading the row for a related test when the design was unrelated.
Writing that the result proves the hypothesis, and leaving out the level of significance at which the decision was made.
Exam tips
- The paper prints the extract from the tables, so every number you need is on the page and the marks come from choosing the right cell and stating the comparison, not from memorising critical values.
- Write the comparison as a sentence containing both values and the level of significance, because the mark scheme credits observed against critical rather than the bare word significant.
- If the stem says the researcher predicted that one group would score higher, that is a directional hypothesis and the one tailed column is the one to use.
- Expect a follow up mark for saying what rejecting the null hypothesis means for the study, so write about the actual variables and participants rather than about hypotheses in the abstract.
Try the lesson
The start of the Handling data: Use statistical tables to determine significance (to include: using an extract from statistical tables to say whether or not a given observed value is significant at the 0.05 level of significance for a one-tailed test) lesson, made from checked teaching notes for this specification point.
Have a go first
A researcher conducts a one-tailed test at the 0.05 level of significance using the Sign test. The observed value of S is 2. The critical value from the statistical table is 3. For the Sign test, the observed value must be equal to or less than the critical value to be significant. What is the correct conclusion?
Listen
An inferential test produces an observed value, and a table of critical values decides whether that value is unlikely enough to count. Reading the table needs three facts from the study: the level of significance, normally 0.05, whether the hypothesis was directional and so one tailed or non directional and so two tailed, and either the number of participants or of pairs or the degrees of freedom. Then the comparison runs in a direction fixed by the test. Chi Square, Spearman's rho, Pearson's r and both t tests need the observed value to be equal to or greater than the critical value. Mann Whitney U, Wilcoxon and the sign test need the observed value to be equal to or less than the critical value before the null hypothesis can be rejected. A strong answer earns marks for these points. Selecting the right cell of the table: the column for p less than or equal to 0.05, the one tailed side for a directional hypothesis, and the row for the degrees of freedom or the value of N that the test uses. Working out degrees of freedom where the test needs them, so Chi Square uses (rows - 1)(columns - 1) and the related t test uses the number of pairs minus one. Stating the comparison in full with both figures, for example that an observed Chi Square value of 7.82 is greater than the critical value of 3.84 for one degree of freedom at p less than or equal to 0.05. Getting the direction of the comparison right for the named test, because an observed Mann Whitney U value must be equal to or less than the critical value while an observed value of rho must be equal to or greater than it. Exam tip: The paper prints the extract from the tables, so every number you need is on the page and the marks come from choosing the right cell and stating the comparison, not from memorising critical values.
See it
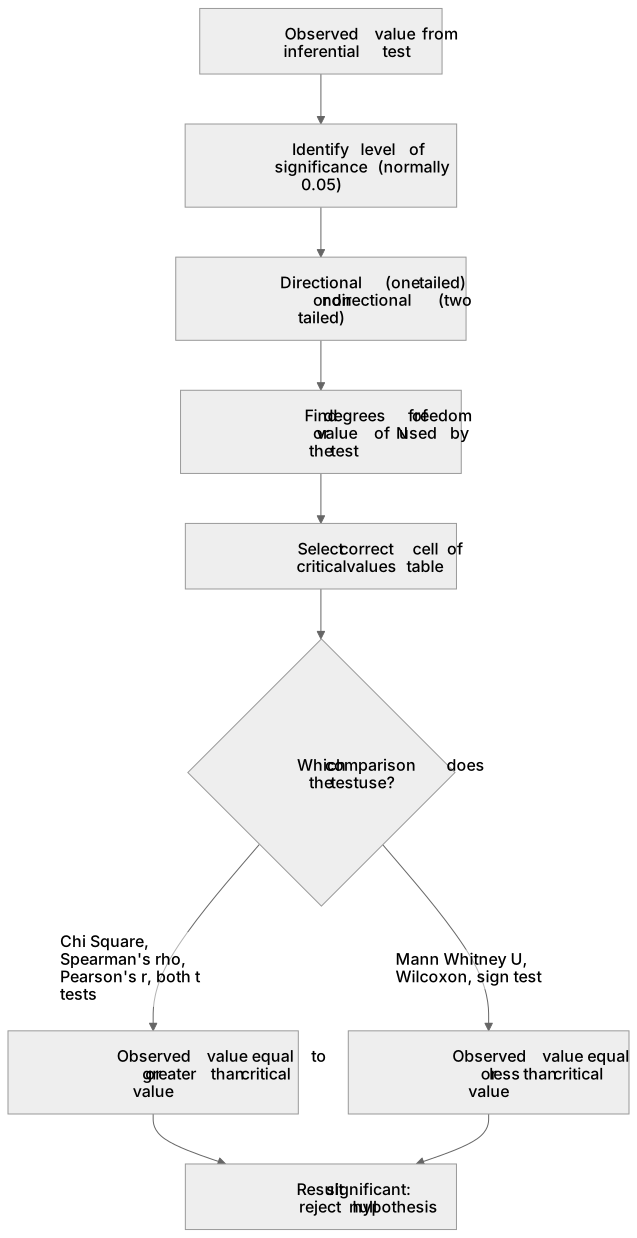
Key words
Say what each word means before you turn the card.
observed and critical values
Try answering aloud or in your head before turning the card.
one tailed and two tailed tests
Try answering aloud or in your head before turning the card.
degrees of freedom
Try answering aloud or in your head before turning the card.
level of significance
Try answering aloud or in your head before turning the card.
See every definition
- observed and critical values
- The observed value comes from the inferential test, and a table of critical values decides whether that value is unlikely enough to count.
- one tailed and two tailed tests
- A directional hypothesis is one tailed, while a non directional hypothesis is two tailed.
- degrees of freedom
- A figure the table may ask for instead of the number of participants or of pairs, worked out where the test needs it.
- level of significance
- Normally 0.05, this is one of the three facts from the study needed for reading the table.
Label the diagram
Some boxes have lost their names. Pick the right name for each number.
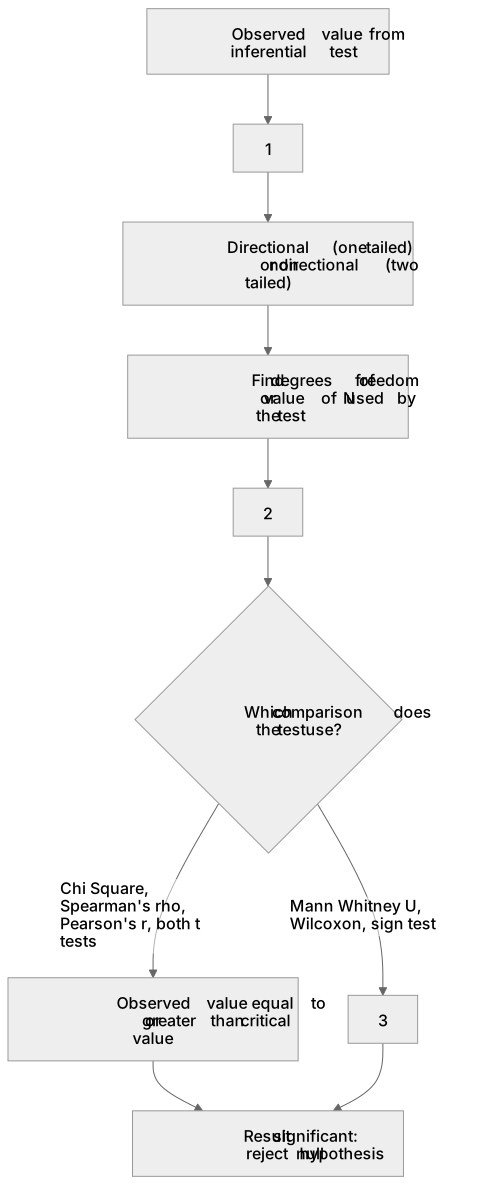
1Box 1
2Box 2
3Box 3
There is more to this lesson
The full lesson goes on to check your understanding and help you earn the marks. Create a free account to carry on, with your progress saved.
A week of Premium from your first lesson · Then the free plan continues · No card, no charge
Test your understanding of Handling data: Use statistical tables to determine significance (to include: using an extract from statistical tables to say whether or not a given observed value is significant at the 0.05 level of significance for a one-tailed test)
Active recall beats re-reading. Take an instant quiz now to test what you’ve learned and lock it into long-term memory.
A week of Premium from your first lesson · Then the free plan continues · No card, no charge