AQA · A-Level · Psychology
Course version: 7182-2025 · Exams from 2027
Understand measures of dispersion, including standard deviation and range…
Full specification wording
Handling data: Understand measures of dispersion, including standard deviation and range (to include: explaining why the standard deviation might be a more useful measure of dispersion for a given set of scores, eg where there is an outlying score)
Two conditions can share a mean and still describe completely different sets of participants, which is why a measure of dispersion is reported alongside every average.
Checked against the AQA 7182-2025 specification (opens in a new tab) on .
- Point 15 of 17
- 4 key terms
Study notes
From the checked teaching notes for this specification point.
The idea
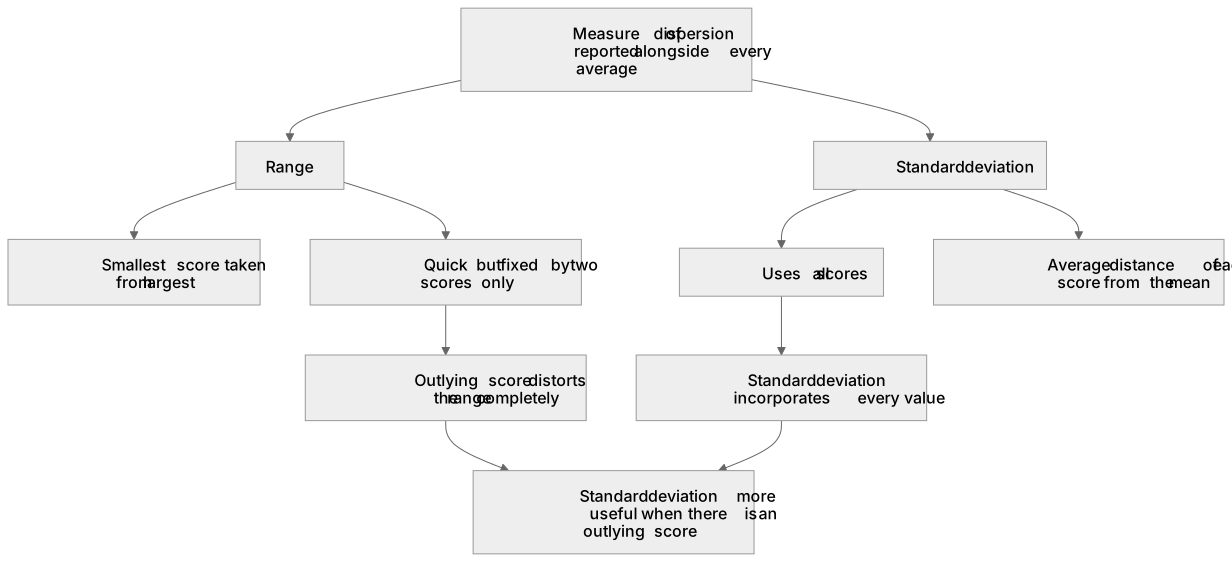
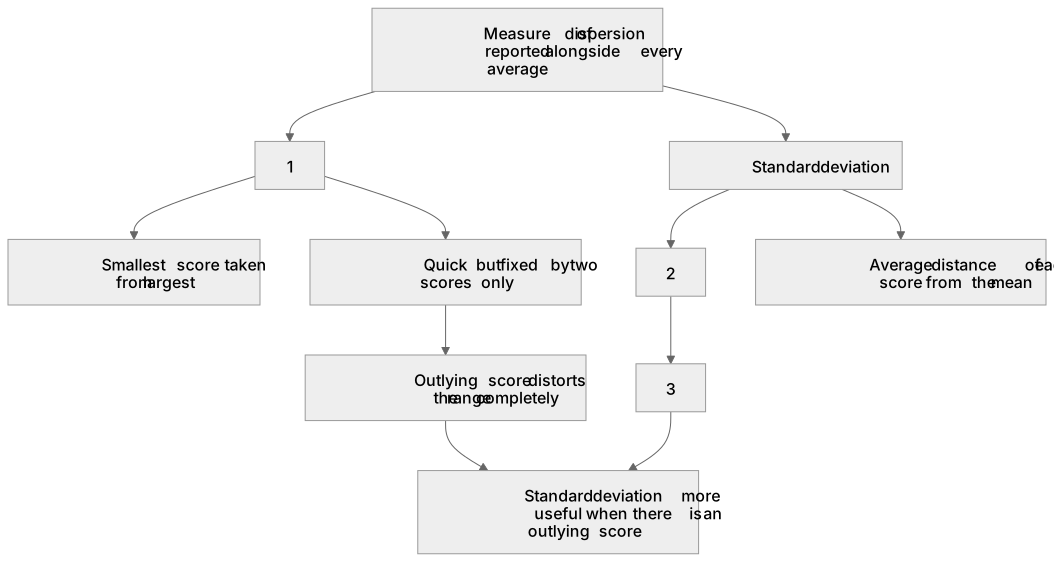
Two conditions can share a mean and still describe completely different sets of participants, which is why a measure of dispersion is reported alongside every average. The range takes the smallest score away from the largest. It is quick but fixed by two scores only. The standard deviation uses all scores, representing the average distance of each score from the mean. A large standard deviation means scores are widely spread; a small one means participants behaved consistently. Standard deviation is a more useful measure of dispersion than the range for a given set of scores when there is an outlying score, because the range is entirely distorted by extremes, whereas standard deviation incorporates every value.
What earns the marks
- Calculating the range correctly from the data given, taking the smallest score from the largest.
- Understanding standard deviation as a measure of spread around the mean, without needing to calculate it from scratch in the exam.
- Interpreting the figure: a standard deviation of 2.1 against a mean of 30 shows scores clustered tightly around the mean, indicating consistent performance.
- Keeping the unit of the original data when interpreting dispersion (e.g., 4.5 seconds).
Common mistakes and how to put them right
Reporting the range as two end scores (e.g., '3-9') rather than the single calculated difference (6).
Attempting to calculate standard deviation manually when the question only asks for interpretation, wasting valuable exam time.
Claiming the standard deviation is completely unaffected by an outlying score.
Put it right: It is affected, but far less distorted than the range because every score contributes.
Exam tips
- When means are similar but standard deviations differ, explain what the difference in spread means for the consistency of participant scores.
- If asked why standard deviation is better, explicitly mention the presence of an outlying score in the given data set.
Try the lesson
The start of the Handling data: Understand measures of dispersion, including standard deviation and range (to include: explaining why the standard deviation might be a more useful measure of dispersion for a given set of scores, eg where there is an outlying score) lesson, made from checked teaching notes for this specification point.
Have a go first
A psychologist is analysing a set of memory test scores. Which of the following best describes what the standard deviation of these scores represents?
Listen
Two conditions can share a mean and still describe completely different sets of participants, which is why a measure of dispersion is reported alongside every average. The range takes the smallest score away from the largest. It is quick but fixed by two scores only. The standard deviation uses all scores, representing the average distance of each score from the mean. A large standard deviation means scores are widely spread; a small one means participants behaved consistently. Standard deviation is a more useful measure of dispersion than the range for a given set of scores when there is an outlying score, because the range is entirely distorted by extremes, whereas standard deviation incorporates every value. A strong answer earns marks for these points. Calculating the range correctly from the data given, taking the smallest score from the largest. Understanding standard deviation as a measure of spread around the mean, without needing to calculate it from scratch in the exam. Interpreting the figure: a standard deviation of 2.1 against a mean of 30 shows scores clustered tightly around the mean, indicating consistent performance. Explaining the advantage in context: the range is fixed by the two extreme scores alone, so a single outlying score changes it completely, while the standard deviation is built from every score and reflects the whole set. Exam tip: When means are similar but standard deviations differ, explain what the difference in spread means for the consistency of participant scores.
See it
Key words
Say what each word means before you turn the card.
measures of dispersion
Try answering aloud or in your head before turning the card.
range
Try answering aloud or in your head before turning the card.
standard deviation
Try answering aloud or in your head before turning the card.
outlying scores
Try answering aloud or in your head before turning the card.
See every definition
- measures of dispersion
- Reported alongside every average because two conditions can share a mean and still describe completely different sets of participants.
- range
- Takes the smallest score away from the largest; it is quick but fixed by two scores only.
- standard deviation
- Uses all scores, representing the average distance of each score from the mean.
- outlying scores
- Extremes that entirely distort the range, whereas standard deviation incorporates every value.
Label the diagram
Some boxes have lost their names. Pick the right name for each number.
1Box 1
2Box 2
3Box 3
There is more to this lesson
The full lesson goes on to check your understanding and help you earn the marks. Create a free account to carry on, with your progress saved.
A week of Premium from your first lesson · Then the free plan continues · No card, no charge
Test your understanding of Handling data: Understand measures of dispersion, including standard deviation and range (to include: explaining why the standard deviation might be a more useful measure of dispersion for a given set of scores, eg where there is an outlying score)
Active recall beats re-reading. Take an instant quiz now to test what you’ve learned and lock it into long-term memory.
A week of Premium from your first lesson · Then the free plan continues · No card, no charge