AQA · GCSE · Biology
Course version: 8461 · Version from Sept 2018
Students should be able to extract and interpret information from charts,…
Full specification wording
Fossils: Students should be able to extract and interpret information from charts, graphs and tables such as evolutionary trees.
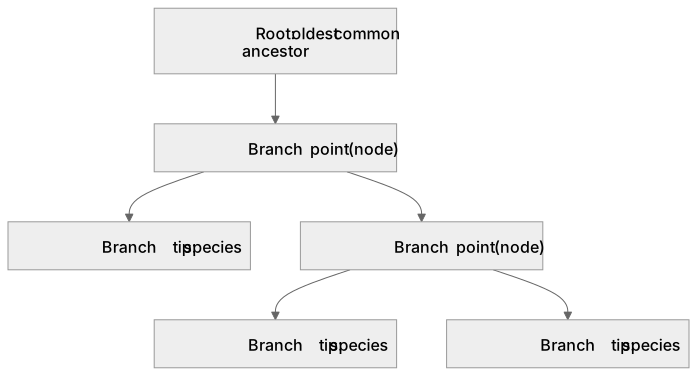
Evolutionary trees are branching diagrams that show relationships between species through common ancestors.
Checked against the AQA 8461 specification (opens in a new tab) on .
- Point 7 of 7
- 3 key terms
Study notes
From the checked teaching notes for this specification point.
The idea
Evolutionary trees are branching diagrams that show relationships between species through common ancestors. To interpret one, identify the root as the oldest common ancestor, follow each branch to a node where lineages split, and read the tips as present-day or extinct species. The more recently two branches join at a node, the more closely related the species are. Charts and tables may instead show fossil age, number of species or characteristic changes, so read the axes, units and headings before quoting values. Extract only the information asked for, then use it to support a statement about change or relationship. Practise describing a path through a tree in words, for example from a shared ancestor to two descendant species.
What earns the marks
- Identify the axes, labels, units and keys of a chart, graph or table before reading any values.
- On an evolutionary tree, locate the common ancestor at a branching point and trace the branches to the species being compared.
- State that species sharing a more recent common ancestor are more closely related than species whose lineages split earlier.
- Extract specific data, such as a fossil age or a number of species, and use it accurately in a written comparison.
- Interpret trends or patterns in the data and link them to evolutionary change rather than merely repeating numbers.
Common mistakes and how to put them right
Reading an evolutionary tree from left to right as a timeline.
Put it right by treating branch points as common ancestors and branch tips as species.
Quoting a value without its unit or without checking the scale.
Put it right by reading the axis label and unit first.
Describing the shape of a graph instead of the biological trend.
Put it right by stating what the pattern shows about the organisms.
Exam tips
- Underline the command word and the data source named in the question before you begin writing.
- Quote figures with units and then add a short interpretation, so each value earns credit for use as well as reading.
- For relationship questions, name the shared ancestor or node that supports your answer rather than saying they look similar.
Try the lesson
The start of the Fossils: Students should be able to extract and interpret information from charts, graphs and tables such as evolutionary trees. lesson, made from checked teaching notes for this specification point.
Have a go first
The table shows the approximate time when fossils of different vertebrate groups first appeared in the geological record.
Vertebrate group : First appearance (millions of years ago) Jawless fish : 480 Bony fish : 420 Amphibians : 370 Reptiles : 310 Mammals : 210
Which statement is supported by the data in the table?
Listen
Evolutionary trees are branching diagrams that show relationships between species through common ancestors. To interpret one, identify the root as the oldest common ancestor, follow each branch to a node where lineages split, and read the tips as present-day or extinct species. The more recently two branches join at a node, the more closely related the species are. Charts and tables may instead show fossil age, number of species or characteristic changes, so read the axes, units and headings before quoting values. Extract only the information asked for, then use it to support a statement about change or relationship. Practise describing a path through a tree in words, for example from a shared ancestor to two descendant species. A strong answer earns marks for these points. Identify the axes, labels, units and keys of a chart, graph or table before reading any values. On an evolutionary tree, locate the common ancestor at a branching point and trace the branches to the species being compared. State that species sharing a more recent common ancestor are more closely related than species whose lineages split earlier. Extract specific data, such as a fossil age or a number of species, and use it accurately in a written comparison. A common slip: Reading an evolutionary tree from left to right as a timeline. Instead, treating branch points as common ancestors and branch tips as species. Exam tip: Underline the command word and the data source named in the question before you begin writing.
See it
Key words
Say what each word means before you turn the card.
Interpreting evolutionary trees
Try answering aloud or in your head before turning the card.
Data handling skills
Try answering aloud or in your head before turning the card.
Common ancestry and relatedness
Try answering aloud or in your head before turning the card.
See every definition
- Interpreting evolutionary trees
- Reading a branching diagram to locate the common ancestor at a branching point and trace the branches to the species being compared.
- Data handling skills
- Identifying the axes, labels, units and keys of a chart, graph or table before reading any values, and extracting only the information asked for.
- Common ancestry and relatedness
- Species sharing a more recent common ancestor are more closely related than species whose lineages split earlier.
There is more to this lesson
The full lesson goes on to check your understanding and help you earn the marks. Create a free account to carry on, with your progress saved.
A week of Premium from your first lesson · Then the free plan continues · No card, no charge
Test your understanding of Fossils: Students should be able to extract and interpret information from charts, graphs and tables such as evolutionary trees.
Active recall beats re-reading. Take an instant quiz now to test what you’ve learned and lock it into long-term memory.
A week of Premium from your first lesson · Then the free plan continues · No card, no charge