AQA · GCSE · Biology
Course version: 8461 · Version from Sept 2018
Students should be able to translate disease incidence information between…
Full specification wording
Health issues: Students should be able to translate disease incidence information between graphical and numerical forms, construct and interpret frequency tables and diagrams, bar charts and histograms, and use a scatter diagram to identify a correlation between two variables.
This skill statement requires students to move between numerical data and graphical displays of disease incidence.
Checked against the AQA 8461 specification (opens in a new tab) on .
- Point 9 of 10
- 4 key terms
Study notes
From the checked teaching notes for this specification point.
The idea
This skill statement requires students to move between numerical data and graphical displays of disease incidence. Incidence means the number of new cases in a population over a period. A frequency table records how often each category or value occurs; a bar chart shows frequencies for discrete categories with gaps between bars; a histogram shows frequencies for continuous data with bars touching. A scatter diagram plots paired values for two variables, and students identify correlation by the overall pattern: positive, negative or no correlation.
For example: Plotting incidence of a disease against year can show a trend, while plotting incidence against a risk factor can suggest a correlation, though correlation does not prove causation.
What earns the marks
- Translate data between numerical tables and graphical displays accurately.
- Construct a frequency table by tallying how often each category or value occurs.
- Draw and interpret bar charts for discrete categories, leaving gaps between bars.
- Draw and interpret histograms for continuous data, with bars touching.
- Plot paired data on a scatter diagram and describe the correlation as positive, negative or none.
- Distinguish correlation from causation when interpreting a scatter diagram.
Common mistakes and how to put them right
Leaving gaps between bars in a histogram.
Put it right by making bars touch because the data are continuous.
Putting gaps between bars in a bar chart incorrectly removed.
Put it right by keeping gaps because the categories are discrete.
Claiming that a correlation proves one variable causes the other.
Put it right by stating that correlation shows a relationship but does not prove causation.
Exam tips
- Label both axes with the variable and unit, and give the graph a clear title.
- Use a sharp pencil and plot points accurately; a point plotted one square out can change the apparent correlation.
- When describing a scatter diagram, state the type and strength of correlation and refer to the overall pattern, not a single point.
Try the lesson
The start of the Health issues: Students should be able to translate disease incidence information between graphical and numerical forms, construct and interpret frequency tables and diagrams, bar charts and histograms, and use a scatter diagram to identify a correlation between two variables. lesson, made from checked teaching notes for this specification point.
Have a go first
A scatter diagram plots the incidence of a specific respiratory disease against the level of air pollution in various towns. The points on the scatter diagram show a clear upward trend from left to right. What is the correct interpretation of this data?
Listen
This skill statement requires students to move between numerical data and graphical displays of disease incidence. Incidence means the number of new cases in a population over a period. A frequency table records how often each category or value occurs; a bar chart shows frequencies for discrete categories with gaps between bars; a histogram shows frequencies for continuous data with bars touching. A scatter diagram plots paired values for two variables, and students identify correlation by the overall pattern: positive, negative or no correlation. For example, plotting incidence of a disease against year can show a trend, while plotting incidence against a risk factor can suggest a correlation, though correlation does not prove causation. A strong answer earns marks for these points. Translate data between numerical tables and graphical displays accurately. Construct a frequency table by tallying how often each category or value occurs. Draw and interpret bar charts for discrete categories, leaving gaps between bars. Draw and interpret histograms for continuous data, with bars touching. A common slip: Leaving gaps between bars in a histogram. Instead, making bars touch because the data are continuous. Exam tip: Label both axes with the variable and unit, and give the graph a clear title.
See it
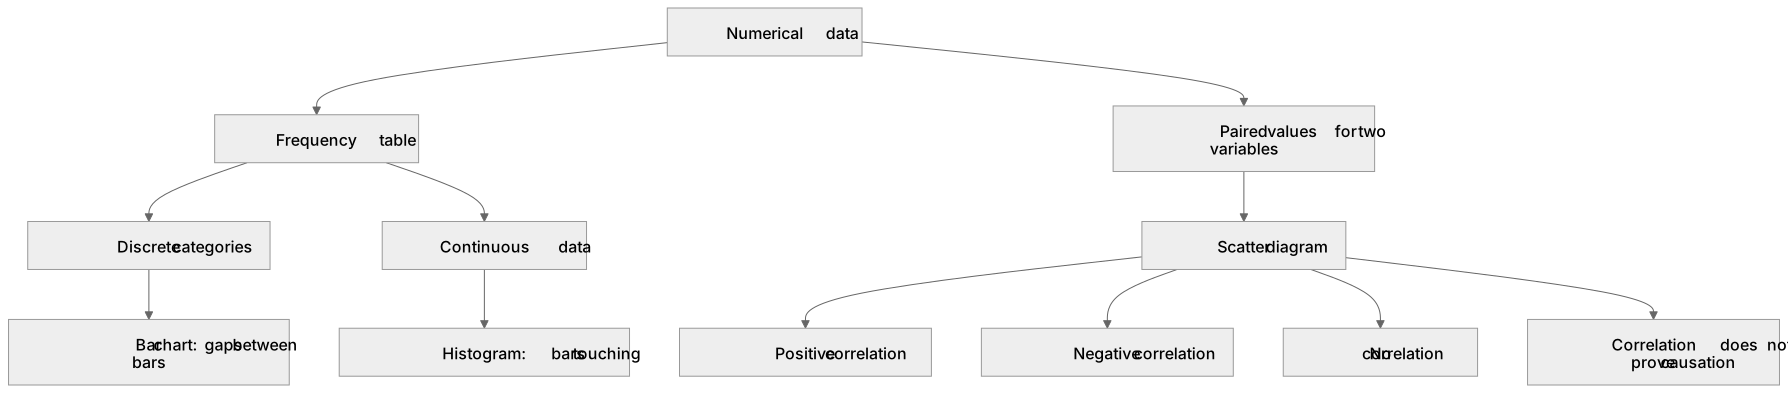
Key words
Say what each word means before you turn the card.
Disease incidence
Try answering aloud or in your head before turning the card.
Frequency table
Try answering aloud or in your head before turning the card.
Histogram
Try answering aloud or in your head before turning the card.
Correlation and causation
Try answering aloud or in your head before turning the card.
See every definition
- Disease incidence
- The number of new cases in a population over a period.
- Frequency table
- A table that records how often each category or value occurs.
- Histogram
- A graph that shows frequencies for continuous data, with bars touching.
- Correlation and causation
- Correlation shows a relationship between two variables, but does not prove causation.
Label the diagram
Some boxes have lost their names. Pick the right name for each number.
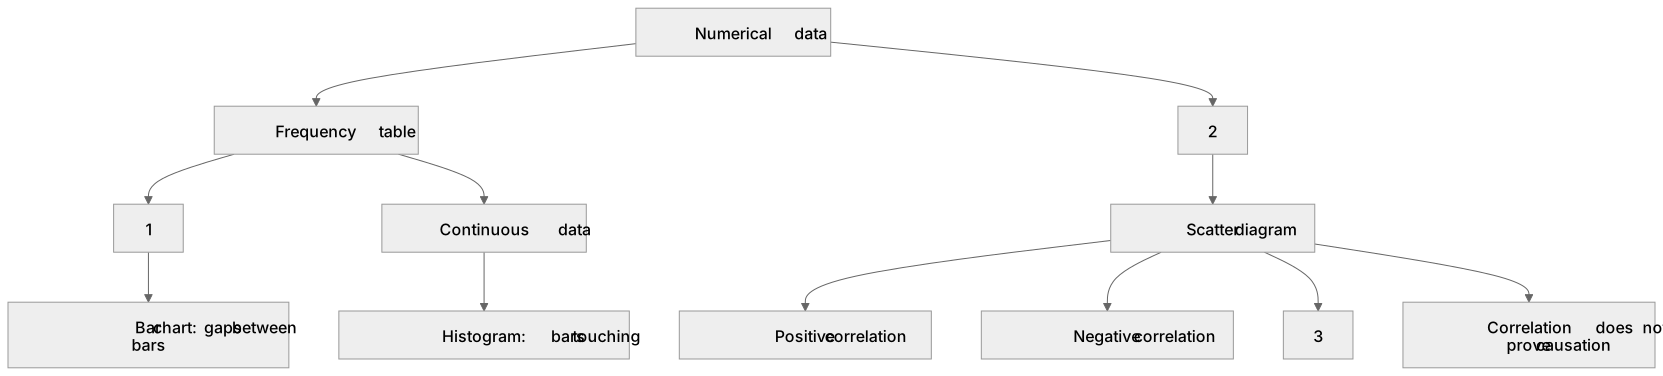
1Box 1
2Box 2
3Box 3
There is more to this lesson
The full lesson goes on to check your understanding and help you earn the marks. Create a free account to carry on, with your progress saved.
A week of Premium from your first lesson · Then the free plan continues · No card, no charge
Test your understanding of Health issues: Students should be able to translate disease incidence information between graphical and numerical forms, construct and interpret frequency tables and diagrams, bar charts and histograms, and use a scatter diagram to identify a correlation between two variables.
Active recall beats re-reading. Take an instant quiz now to test what you’ve learned and lock it into long-term memory.
A week of Premium from your first lesson · Then the free plan continues · No card, no charge